AI Diag is a beta feature available on the subscriber screen. It combines an automated diagnostic pipeline with an AI Assistant to help operators investigate the subscriber's current service and network conditions.
AI Diag is divided into two main areas: the Diagnostic Pipeline and the AI Assistant. The Diagnostic Pipeline automatically evaluates different parts of the subscriber's service, while the AI Assistant uses those diagnostic results as context to help interpret the situation and suggest possible next steps.
The Diagnostic Pipeline is displayed on the main area of the AI Diag tab. The AI Assistant is located on the right side of AI Diag (Beta) and can be used without manually repeating information already collected by the diagnostics.
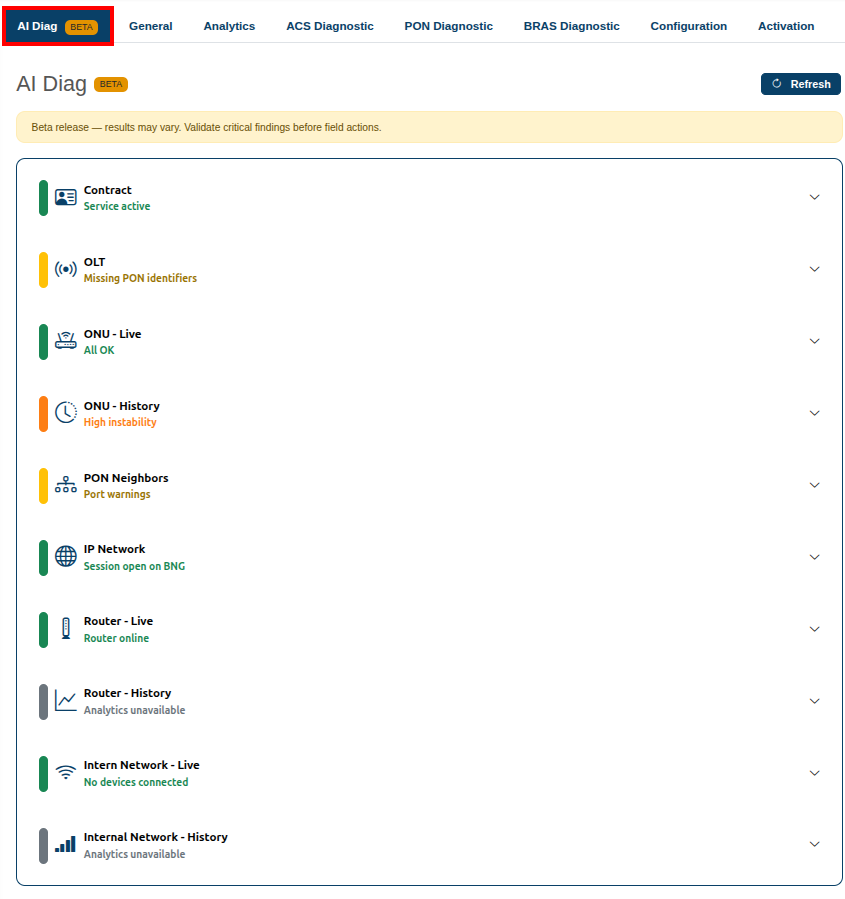
AI Diag is currently in beta. Results may vary, and critical findings should be validated before being used as the basis for field or configuration actions.
The Diagnostic Pipeline automatically runs a sequence of checks covering different parts of the subscriber's service and network environment.
Each diagnostic is displayed as a collapsible section with its current status. When additional information is available, the section can be expanded to show findings, diagnostic details, and recommended actions.
The Diagnostic Pipeline itself does not depend on AI. It is a structured summary created from the subscriber and network information available to the Portal.
If a check cannot be completed because required information is unavailable, provisioning is missing, or an integration cannot return the necessary data, the section displays a corresponding status such as No data available or No provisioning instead of treating the condition as a subscriber failure.
The Diagnostic Pipeline is not available for FWA (fixed-wireless) subscribers.
Checks whether the subscriber's contracted service is active and displays information such as the contracted plan speed, subscriber document, and installation address.
It can identify conditions such as a deactivated service, financial blocking, or a service operating at reduced speed.
Checks the ONU's basic PON provisioning information, including the associated OLT and PON port, serial number, MAC address, ONU model, and OLT or monitoring-agent reachability.
It can identify missing provisioning identifiers, an ONU that is not provisioned on the OLT, an unfinished installation, or inconsistencies between the documented CTO/splitter association and the ONU's actual PONLink.
Checks the ONU's current optical and provisioning conditions in real time.
The evaluation can include loss of signal, power failure alarms, optical receive power, active alarms or traps, WAN and MAC provisioning, and Ethernet port status on bridge-mode ONUs.
This section helps determine whether the ONU is currently operating normally.
Analyzes ONU stability over the last 24 hours, 7 days, and 30 days, including loss-of-signal and power-failure occurrences.
It also evaluates whether these events were isolated to the subscriber or associated with a shared or massive network event.
The subscriber's event history can be compared with other subscribers on the same PON port, helping distinguish an individual fiber issue from a broader port-related problem.
Analyzes the ONUs that share the same PON port as the subscriber.
The section can show how populated the port is, whether neighboring ONUs are also experiencing problems, and how the subscriber's optical signal and fiber distance compare with other ONUs on the same port.
This information helps distinguish a subscriber-specific fiber issue from a condition affecting the PON port as a whole.
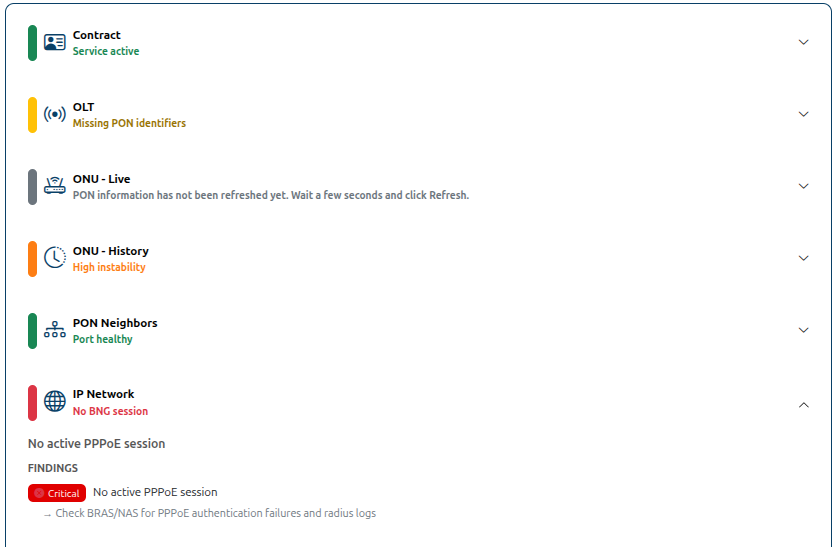
Checks whether the subscriber currently has an active Layer 3 / PPPoE session and can display information such as the assigned IP address, BRAS/NAS server, and session uptime.
It can also identify situations where an active session exists while the contract is blocked or configured to operate at reduced speed.
Checks whether the subscriber's router or CPE is currently online and reachable through remote management (ACS).
It also verifies whether the device has been provisioned and whether the most recently received information is current or outdated.
Analyzes router health trends over the last 24 hours and 7 days, including reboot frequency, CPU usage, memory usage, and temperature.
It can identify conditions such as frequent reboots, sustained resource usage, or overheating.
Provides a current view of devices connected to the subscriber's Wi-Fi and wired network.
It can identify devices with weak Wi-Fi signal, an unusually high number of connected devices, or situations where most wireless devices are concentrated on the 2.4 GHz band.
Analyzes Wi-Fi quality trends over the last 24 hours and 7 days.
The available information can include signal strength per connected device over time, band congestion, discarded packets, and an overall connection-quality score.
This historical view complements the live information by helping identify conditions that may not be visible in a single point-in-time check.
Reviews diagnostic tests executed for the subscriber during the last 24 hours, including ping, download and upload speed tests, traceroute, Wi-Fi scans, and DNS lookups.
Results are evaluated against configured thresholds such as latency, packet loss, speed compared with the contracted plan, unresponsive route hops, and Wi-Fi channel congestion.
The AI Assistant is located on the right side of the AI Diag (Beta) interface. It provides a conversational interface for working with the subscriber's diagnostic information.
The assistant automatically receives the results generated by the Diagnostic Pipeline. This means you can ask questions about the subscriber's situation without manually copying or repeating the information displayed in the diagnostic sections.
The assistant can summarize diagnostic findings, explain detected conditions, suggest possible next steps, and answer questions in natural language.
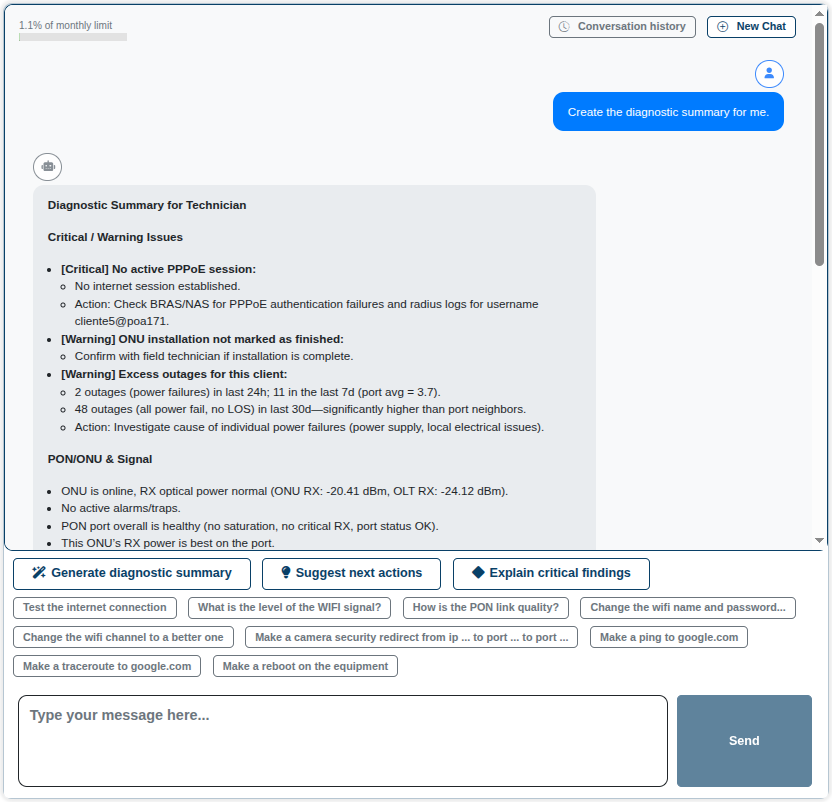
You can type a question directly into the conversation or use one of the available quick-start actions.
Examples include requesting a diagnostic summary, asking for suggested next actions, or requesting an explanation of critical findings.
Additional suggested questions and actions may also be displayed according to the subscriber's current diagnostic context.
Access to the AI Diag tab and access to the AI Assistant are controlled separately.
To access AI Diag, the user must have permission to view ACS diagnostics through the CS Overview permission group.
To use the AI Assistant, the following additional requirements must also be met:
- An active AI license must be available for the company.
- AI must be configured for the environment.
- The user must have the AI Assistant permission.
If the AI Diag tab is available but one of the AI Assistant requirements is missing, the assistant area remains unavailable and indicates that the required access or configuration is not available.
The Diagnostic Pipeline results are automatically provided to the AI Assistant as context.
For example, if the diagnostics identify that the ONU is online but there is no active PPPoE session, the assistant can use that information when generating a summary or suggesting what should be investigated next.
In addition to explaining diagnostic information, the AI Assistant can perform certain supported configuration changes during the conversation.
Depending on the available functionality, these actions can include adjustments to Wi-Fi or router settings, WAN or port-mapping configuration, DHCP settings, or rebooting the ONU or router.
Configuration changes are executed under the identity of the user interacting with the assistant, as if the user had performed the action manually.
Review and confirm configuration changes suggested by the AI Assistant using the same validation process that would be applied to a manual change.
The AI conversation itself, including questions and answers, is not recorded in the platform's standard audit trail.
Configuration changes performed through the AI Assistant are recorded separately in the same way as equivalent manual changes.
AI Assistant usage is subject to a shared monthly usage limit across all users.
The AI Assistant interface displays the current consumption of the available monthly limit.
If the limit is reached, the assistant displays an error and stops responding until usage becomes available again. If users encounter this condition, an administrator can verify whether the monthly AI usage limit has been reached.