¶ 📊 Analytics Dashboard (ACS Analysis)
The Analytics Dashboard is the tool responsible for consolidating and presenting metrics from devices monitored via ACS, enabling performance, stability, and behavior analysis across the equipment base.
¶ 📥 Available Reports
At the top of the screen, report download menus are available, with export options in the following formats:
- CSV
- Excel
¶ 📌 Available report types:
- 📶 RSSI Report
- 🌐 GPON Report
- 🔄 Reboot Report
- 🧠 CPU/Memory Report
- 🌡️ Temperature Report
- 📊 Consumption Report
Each report can be accessed individually through the buttons at the top.
¶ 📈 Device Metrics Time-Series Charts
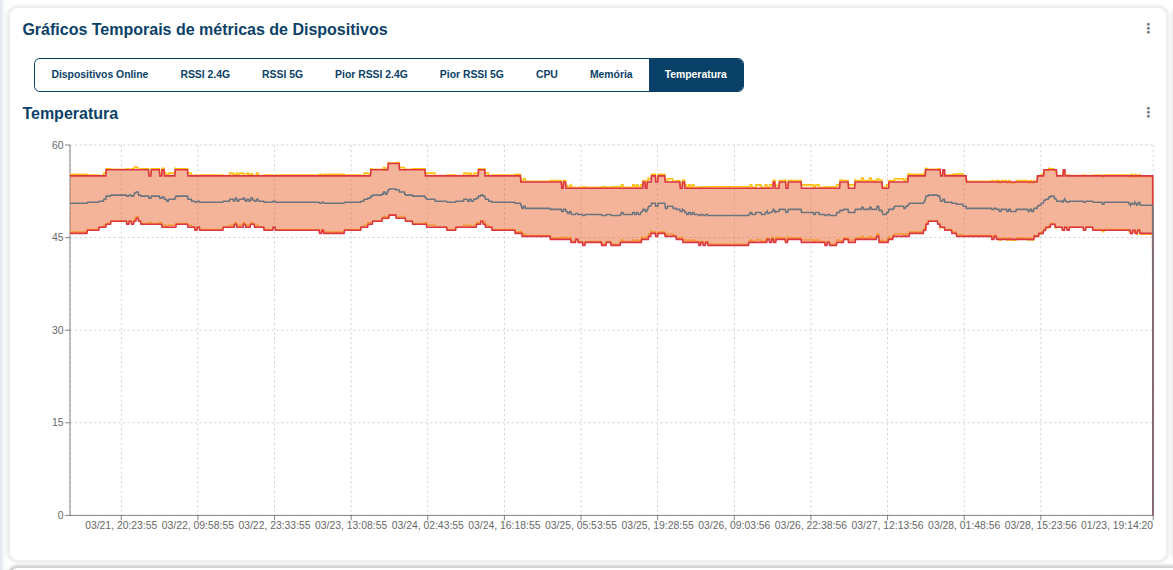
Allows tracking the evolution of metrics over time.
¶ 📌 Available metrics:
- 🟢 Online Devices
- 📶 RSSI 2.4G
- 📶 RSSI 5G
- ⚠️ Worst RSSI 2.4G
- ⚠️ Worst RSSI 5G
- 🧠 CPU
- 💾 Memory
- 🌡️ Temperature
Users can switch between indicators for a detailed analysis of device behavior.
¶ 📊 Histogram Charts
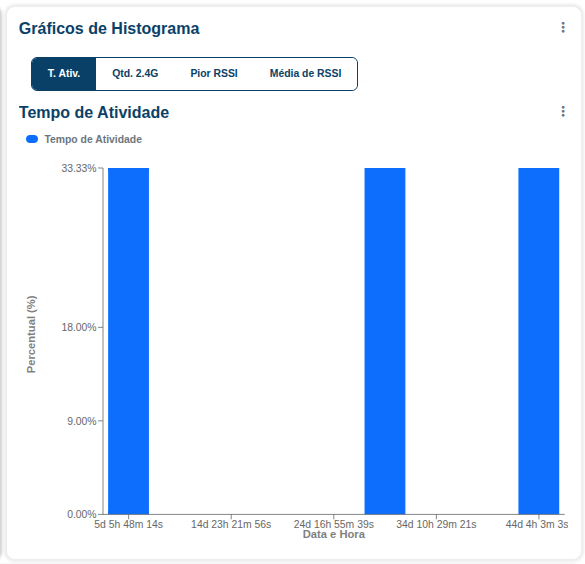
Display data distribution in statistical format.
¶ 📌 Available indicators:
- ⏱️ Uptime
- 📡 2.4G Count
- ⚠️ Worst RSSI
- 📊 Average RSSI
These charts help identify patterns and anomalies across the device base.
¶ 🏆 Device Rankings
List of devices with the highest or lowest indicators, making it easier to identify issues or standout equipment.
¶ 📌 Available rankings:
- 💾 Devices with Highest Memory Usage
- 🧠 Devices with Highest CPU Usage
- 🌡️ Devices with Highest Temperature
- ⏱️ Devices with Longest Uptime
- 📡 Devices with Lowest GPON RX
- 🔄 Devices that Recently Rebooted
¶ 📡 Wi-Fi Traffic Rankings
Displays devices with the highest traffic consumption on wireless networks.
¶ 📌 Available indicators:
- 📶 Devices with Highest 2.4G Traffic
- 📶 Devices with Highest 5G Traffic
¶ 🎯 Dashboard Purpose
The Analytics Dashboard allows you to:
- Monitor device health
- Identify signal issues (RSSI)
- Detect high resource consumption (CPU/Memory)
- Analyze stability (reboots and uptime)
- Evaluate GPON network quality
- Identify equipment with high traffic consumption
¶ ⚠️ Notes
- The data displayed depends on active communication with the ACS
- Offline equipment may not reflect up-to-date data
- Periodic analysis is recommended for incident prevention