The General Dashboard provides a consolidated view of the main operational, network, service, and installation indicators available in the Portal.
¶ What is the General Dashboard?
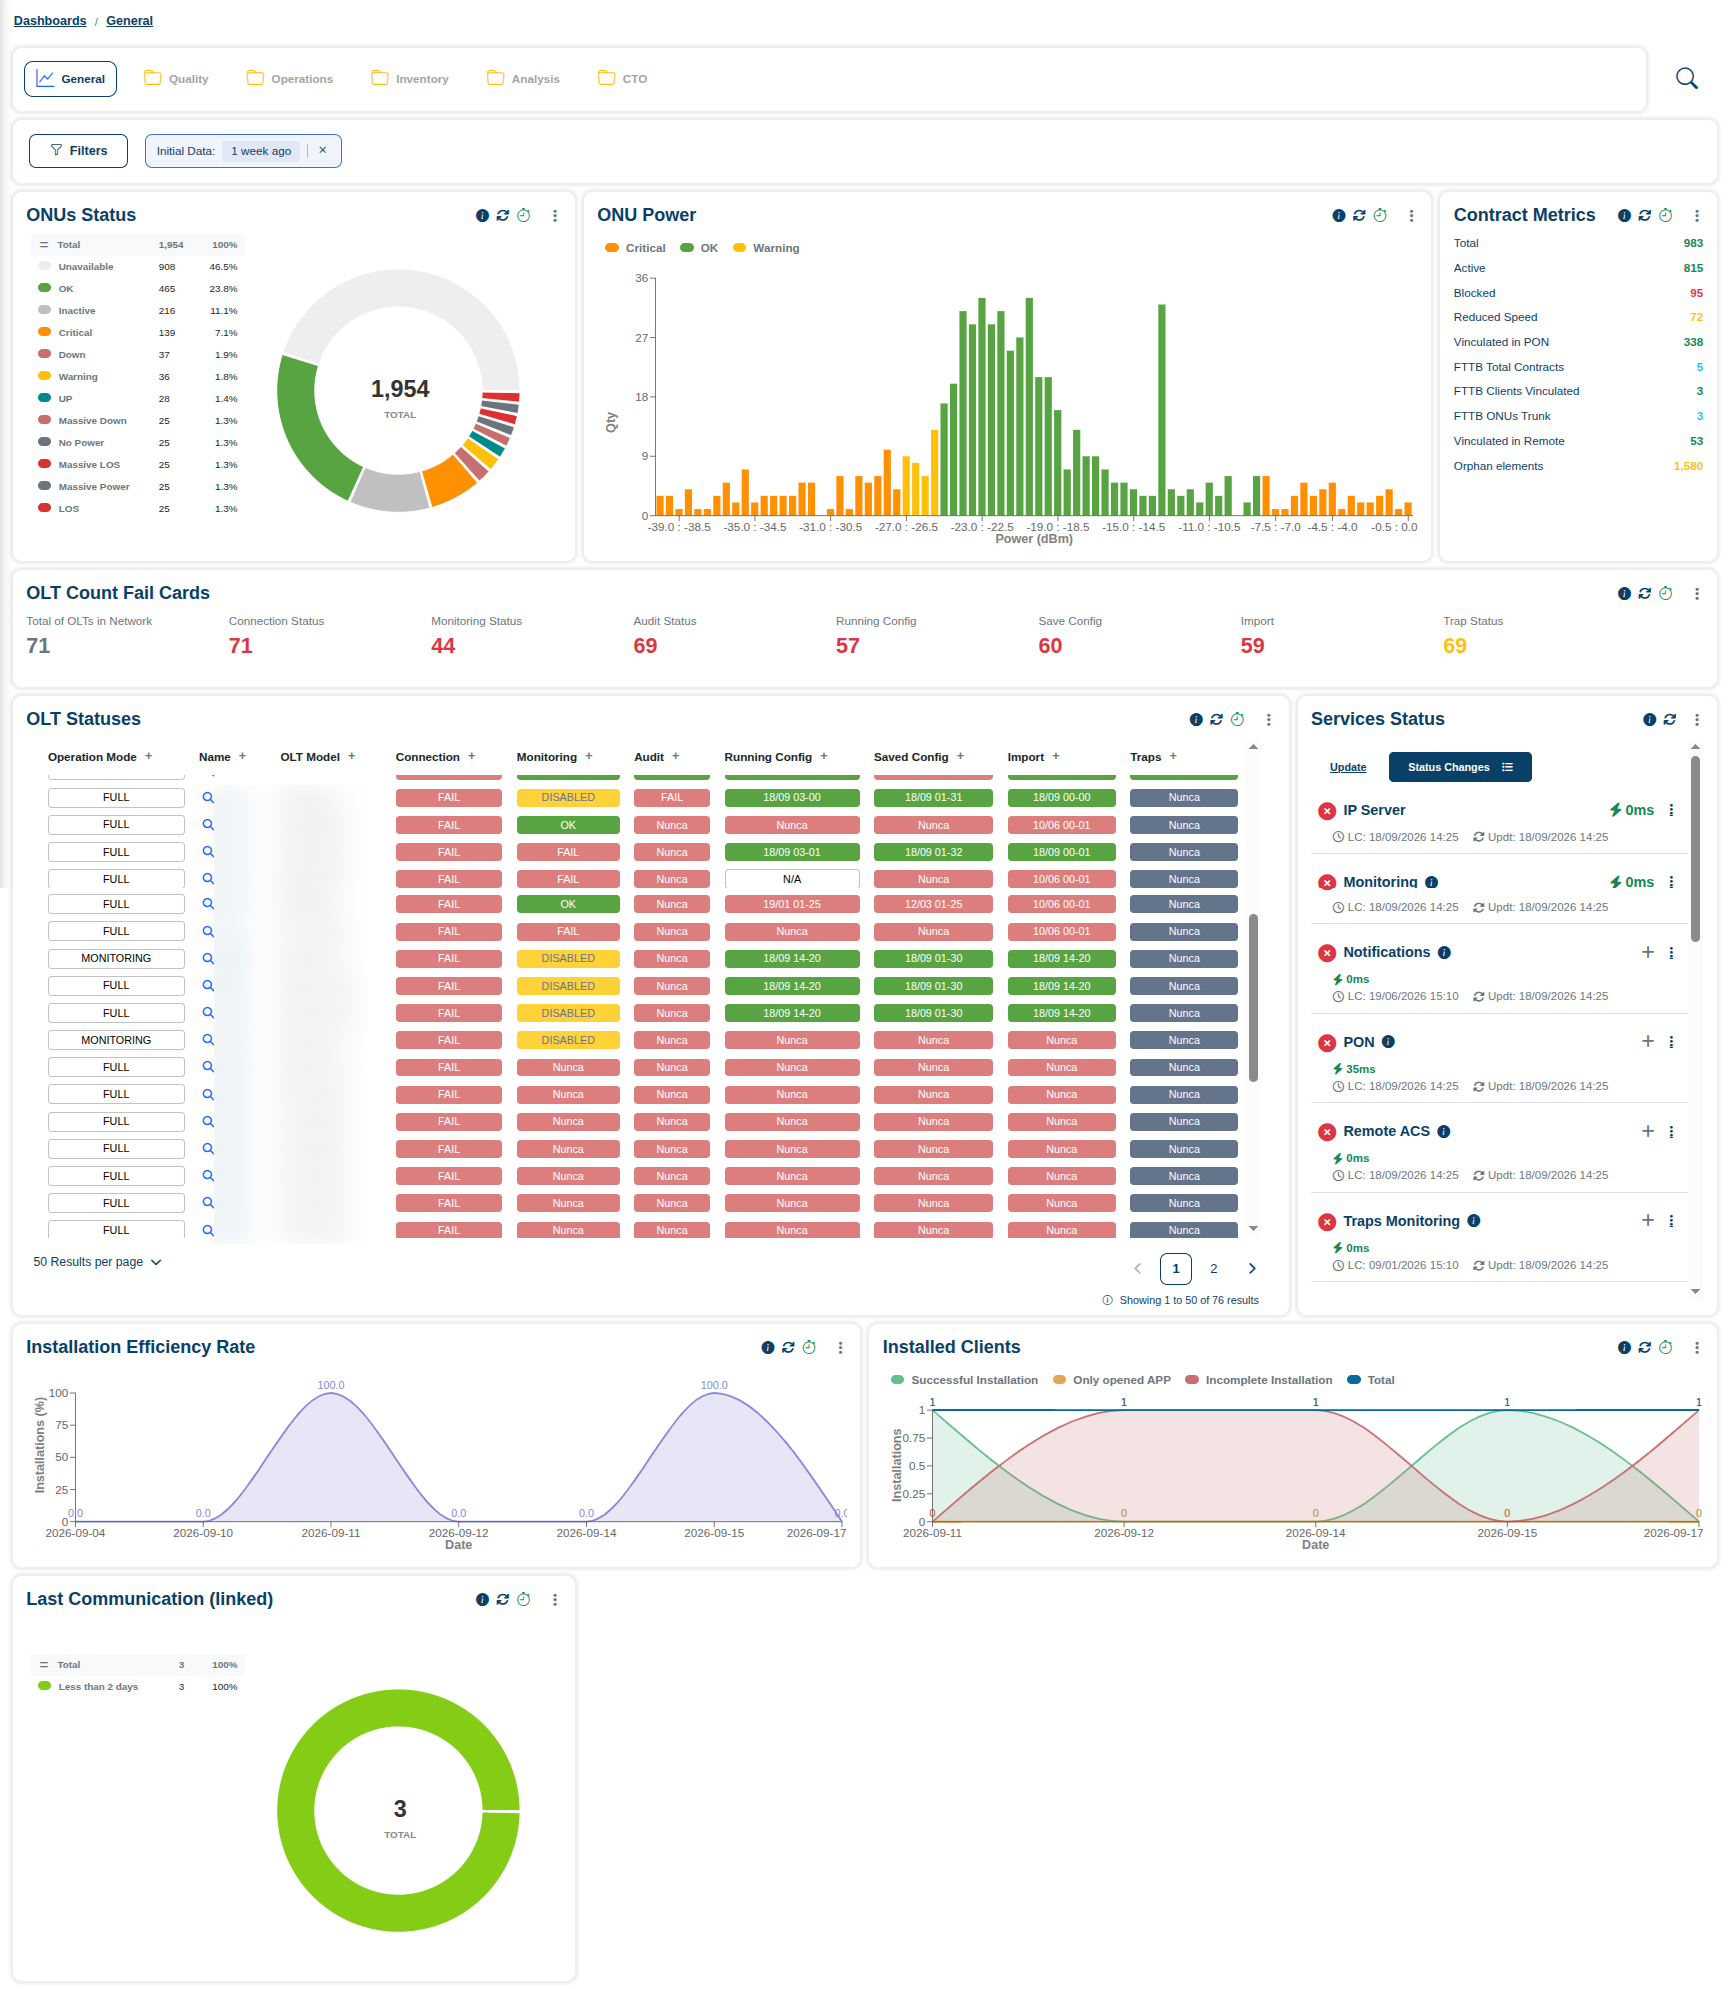
The General Dashboard is the main monitoring view available under Dashboards. It combines information about ONUs, OLTs, contracts, service availability, optical power, and installation activity in a single screen.
The dashboard is designed to provide a quick overview of the current network scenario, allowing operators to identify abnormal conditions and determine which areas may require further investigation.
¶ Dashboard Navigation
The navigation bar at the top of the dashboard provides access to the different monitoring areas available in the Portal.
| Section | Description |
|---|---|
| General | Provides a consolidated overview of the main network and operational indicators. |
| Quality | Provides access to indicators related to network and service quality. |
| Operations | Groups information related to operational activities and network monitoring. |
| Inventory | Provides access to infrastructure and equipment-related information. |
| Analytics | Provides access to analytical views used to investigate network behavior and operational data. |
| FOTB | Provides access to information related to FOTB infrastructure. |
¶ Filters
The Filters area allows operators to refine the information displayed on the General Dashboard according to network, contract, device, service, integration, and partner-related criteria.
| Filter | Description |
|---|---|
| OLT State | Filters dashboard information according to the OLT state. |
| Contract City | Filters records according to the city associated with the contract. |
| OLT Name | Filters information by a specific OLT name. |
| Contract State | Filters records according to the state associated with the contract. |
| OLT City | Filters information according to the city where the OLT is located. |
| Initial Date / Final Date | Defines the initial date considered when loading dashboard information. |
| ERP ID | Filters records according to the associated ERP identifier. |
| ONU Serial Number | Filters information by ONU serial number. |
| User | Filters records according to the associated user. |
| Ponlink | Filters information according to a specific PON link. |
| Minimun RX | Defines the minimum RX optical power value considered by the filter. |
| Maximun RX | Defines the maximum RX optical power value considered by the filter. |
| ONU Status | Filters ONUs according to their current status. |
| OLT Model | Filters information according to the OLT model. |
| Service Status | Filters information according to the current service status. |
| Integration | Filters information according to the integration associated with the records. |
| Parter | Filters dashboard information according to the associated partner. |
Default value:
When the General Dashboard is opened, only the initial_date filter is automatically applied, with the value set to 1 week ago. All other filters remain unset until manually selected by the user.
Multiple filters can be combined to narrow down the dashboard results. Once applied, the dashboard components are updated according to the selected criteria.
¶ Dashboard Components
Provides an overview of the current status distribution of ONUs monitored by the Portal.
The donut chart displays the total number of ONUs and groups them by status. The legend provides the quantity and percentage associated with each status, such as Unavailable, OK, Inactive, Critical, Down, Warning, UP, and other monitored conditions.
This component helps operators quickly identify how ONUs are distributed across normal, unavailable, warning, and failure-related states.
Displays the distribution of ONU optical power measurements.
The horizontal axis represents optical power in dBm, while the vertical axis represents the number of ONUs detected within each power range.
Measurements are visually classified into Critical, OK, and Warning ranges, making it easier to identify concentrations of ONUs operating outside the expected optical power range.
Summarizes contract and subscriber-related information available in the Portal.
The component includes indicators such as total contracts, active contracts, blocked contracts, reduced-speed contracts, PON-linked contracts, FTTB information, remote-linked records, and orphan elements.
It provides a quick reference for evaluating the current distribution of contracts and their relationship with the network infrastructure.
Provides counters related to the operational state and validation of OLTs in the network.
The section displays the total number of OLTs in the network together with counters for Connection Status, Monitoring Status, Audit Status, Running Config, Save Config, Import, and Trap Status.
These counters provide a high-level indication of areas that may require attention before the operator proceeds to the detailed OLT information.
Provides a detailed view of the operational condition of each OLT displayed by the dashboard.
Each row represents an OLT and includes information such as its operation mode, name, model, connection status, monitoring status, audit status, running configuration, saved configuration, import information, and trap status.
| Field | Description |
|---|---|
| Operation Mode | Indicates the current operating mode associated with the OLT. |
| Name | Identifies the OLT. |
| OLT Model | Displays the OLT model. |
| Connection | Shows the current connection status. |
| Monitoring | Shows the current monitoring status. |
| Audit | Displays information related to the OLT audit status. |
| Running Config | Displays information associated with the running configuration. |
| Saved Config | Displays information associated with the saved configuration. |
| Import | Displays information related to OLT data import. |
| Traps | Displays information related to trap monitoring. |
Status colors and labels help operators identify normal conditions, failures, disabled monitoring, unavailable information, or the most recent recorded configuration information.
Displays the current condition of services used by the Portal and network operations.
Services visible in this component may include IP Server, Monitoring, Notifications, PON, Remote ACS, and Traps Monitoring.
Each service entry displays its status together with additional operational information, such as response time and the timestamps associated with its latest checks or updates.
This component allows operators to quickly identify whether an issue observed in the dashboard may also be associated with one of the supporting services.
Presents the installation efficiency percentage over time.
The horizontal axis represents the date, while the vertical axis represents the installation rate as a percentage.
This chart can be used to observe changes in installation efficiency throughout the selected period.
Presents installation results over time and separates them according to their current outcome.
The chart includes Successful Installation, Only opened APP, Incomplete Installation, and Total indicators.
This view helps operators compare completed installations with incomplete or initiated installation processes during the selected period.
Displays the distribution of linked records according to the recency of their last communication.
The donut chart shows the total number of linked records considered by the component and groups them according to the available communication time ranges, such as Less than 2 days.
This component provides a quick way to identify whether linked records have communicated recently with the platform.
¶ Card Controls
Some dashboard cards provide additional actions in their upper-right corner, including contextual information, data refresh, and additional options. The controls available may vary according to the component.
Because dashboard information is dynamic, displayed values may change according to the selected filters, network conditions, service status, and the latest data collected by the Portal.