¶ FOTBs
¶ 📊 FOTB Dashboard
The FOTB Dashboard presents a consolidated view of the optical termination boxes imported into the Portal, allowing quick access to operational information, sanitization status, occupancy, and inconsistencies.
In addition, the dashboard offers a robust set of filters for detailed analysis and a summary panel with key indicators of ports and FOTBs.
¶ 🔍 Dashboard Filters
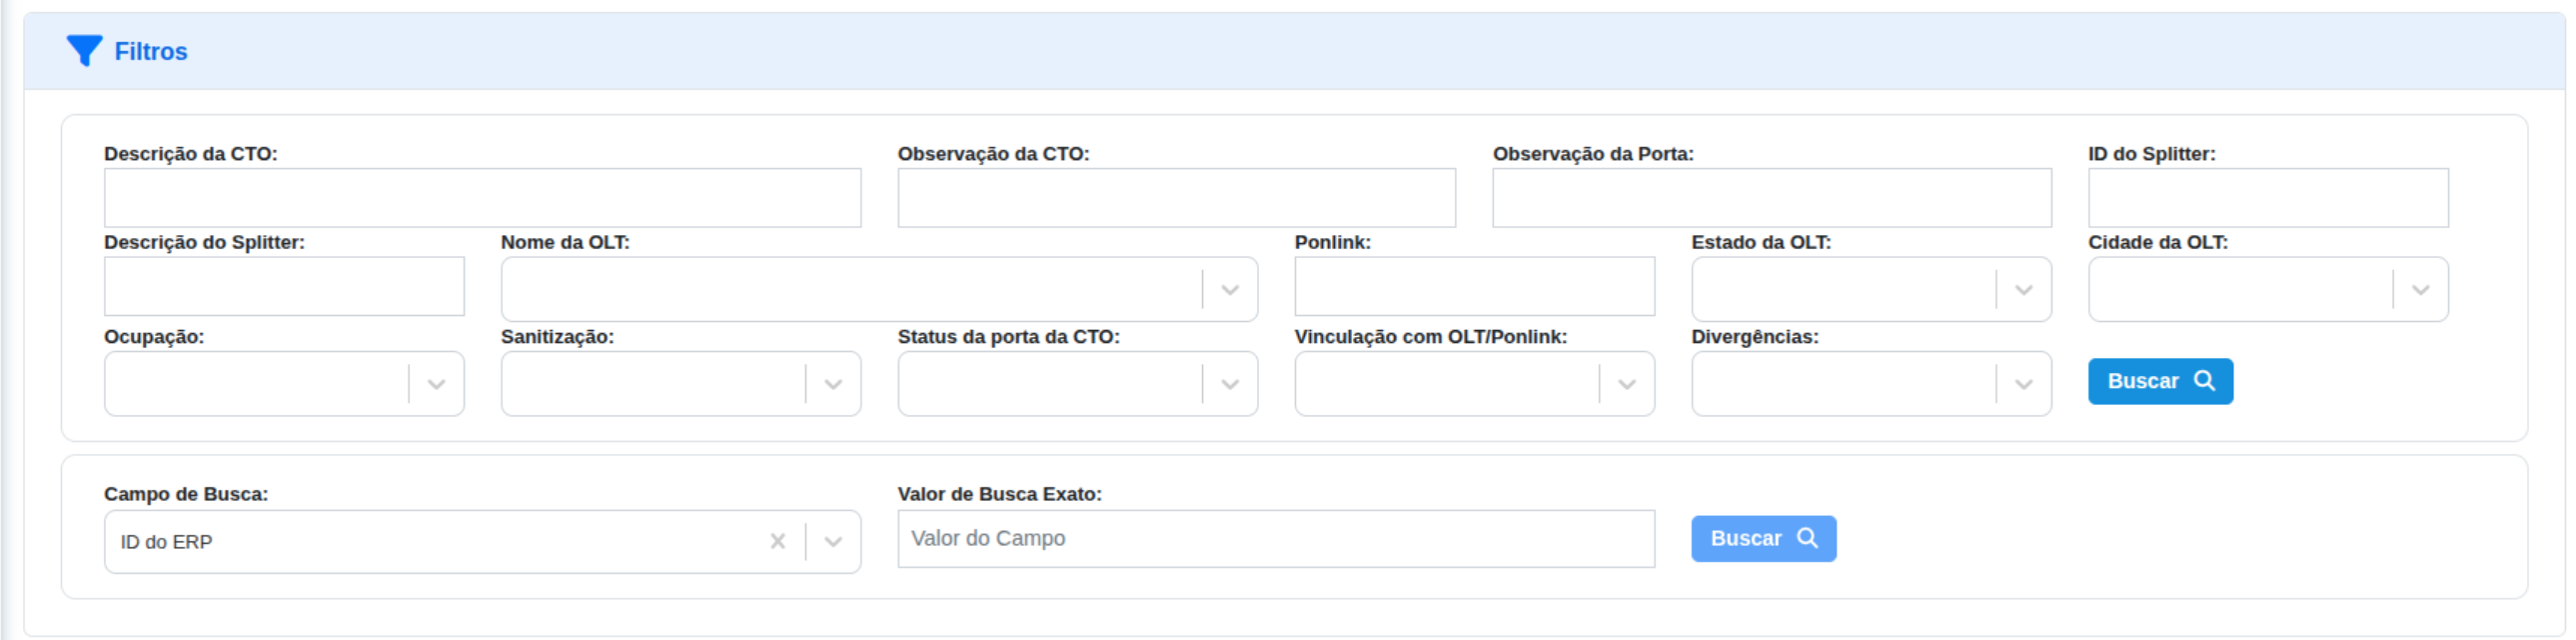
Filters allow refining the search for FOTBs, ports, and splitters.
The table below lists all available filters and their purpose:
| 🧩 Filter | 📄 Description |
|---|---|
| FOTB Description | Search FOTBs by registered name. |
| FOTB Observation | Filters FOTBs that contain relevant notes. |
| Port Observation | Filters ports with specific observations. |
| Splitter ID | Search by the unique identifier of the splitter associated with the FOTB. |
| Splitter Description | Search splitters by configured name/description. |
| OLT Name | Filters FOTBs linked to a specific OLT. |
| Ponlink | Search by the PON identification linked to the FOTB. |
| OLT State | Filters FOTBs by the state associated with the OLT. |
| OLT City | Filters by the city where the OLT is located. |
| Occupancy | Filters FOTBs by port occupancy level (low, medium, high). |
| Sanitization | Filters FOTBs by sanitization status (sanitized, partially sanitized, no sanitized ports). |
| Port Status | Filters ports by operational status (available, occupied, estimated, reserved, etc.). |
| OLT/Ponlink Link Status | Displays only correctly linked FOTBs or those with linkage problems (orphan FOTB). |
| Inconsistencies | Filters FOTBs with inconsistencies between systems (FOTB Ponlink differs from client Ponlink). |
| Search Field | Allows filtering by specific fields. |
| Exact Search Value | Searches for exact values in the selected field. |
¶ 📈 Indicators Panel
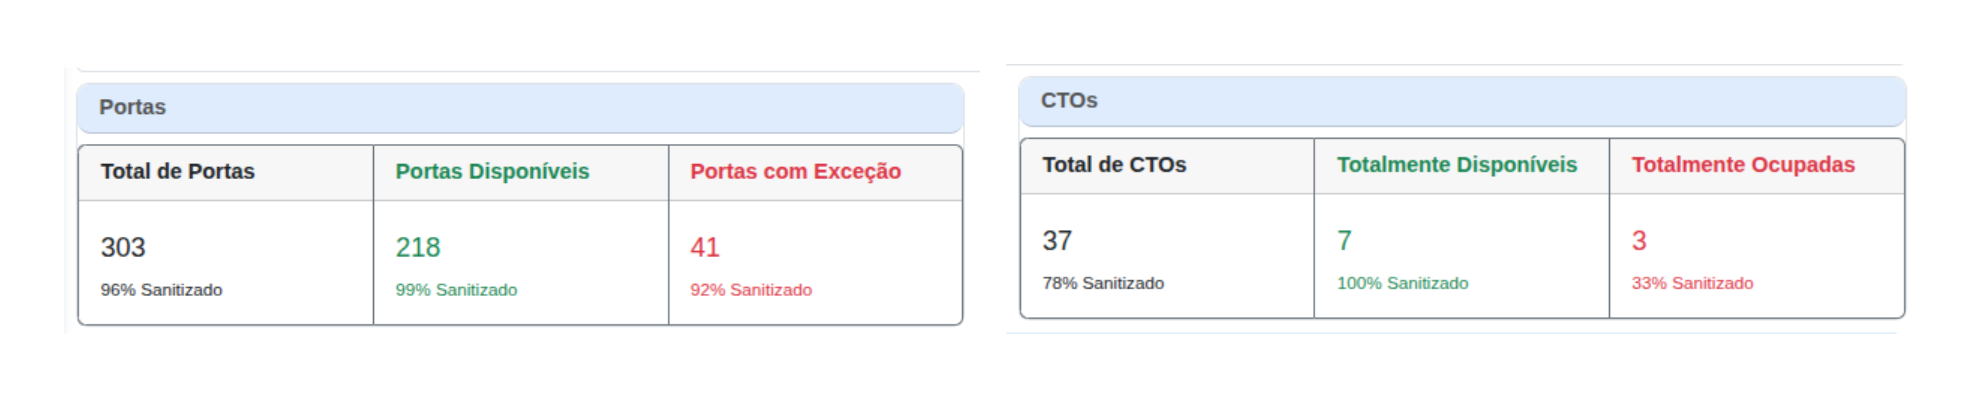
The dashboard presents a summary of the main indicators of FOTBs and ports imported into the portal.
These data help quickly identify the operational status of the network.
¶ 🔢 Port Indicators
| 🔧 Indicator | 📌 Description |
|---|---|
| Total Ports | Total number of ports imported into the Portal. |
| Available Ports | Free ports available for installation. |
| Exception Ports | Ports flagged with issues, inconsistencies, or special situations. |
¶ 🗂️ FOTB Indicators
| 🧩 Indicator | 📌 Description |
|---|---|
| Total FOTBs | Total number of imported FOTBs. |
| Fully Available | FOTBs where all ports are free. |
| Fully Occupied | FOTBs where all ports are occupied. |
¶ 🧩 FOTBs in the Plant (First 100)
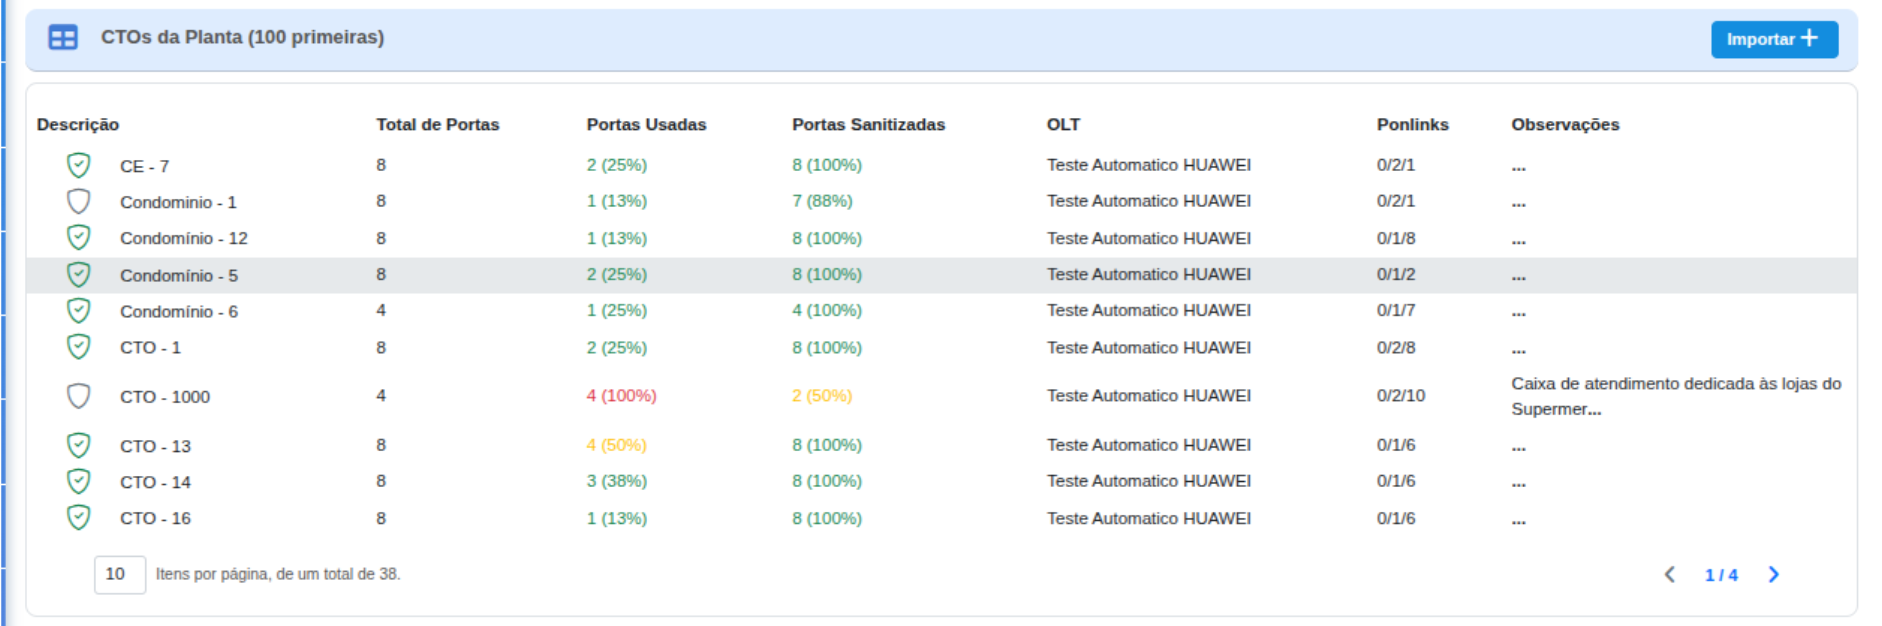
The FOTBs in the Plant section displays a list of the first 100 FOTBs imported into the Portal, allowing quick visualization of occupancy, sanitization, associated OLT, and other essential information.
When filters are applied, this table stops showing the first 100 and instead displays the filtered result.
¶ 🛡️ Sanitization Visual Status
Each row has a shield icon indicating sanitization level:
| Icon | Meaning |
|---|---|
| 🟩 Green shield with ✓ | Fully sanitized FOTB (100% of ports reviewed). |
| ⬜ Gray empty shield | FOTB not fully sanitized. |
¶ 📑 Table Columns
| Field | Description |
|---|---|
| Description | FOTB name as registered in ERP or GIS. |
| Total Ports | Total number of ports in the FOTB. |
| Used Ports | Number and percentage of currently occupied ports. |
| Sanitized Ports | Number of ports already sanitized. |
| OLT | OLT equipment to which the FOTB is linked. |
| Ponlink | PON link associated with the FOTB. |
| Observations | Notes manually inserted or imported from integrations. |
¶ 🖱️ Selecting a FOTB
Click any FOTB row to open the detailed view.
¶ 🗺️ FOTB Map View
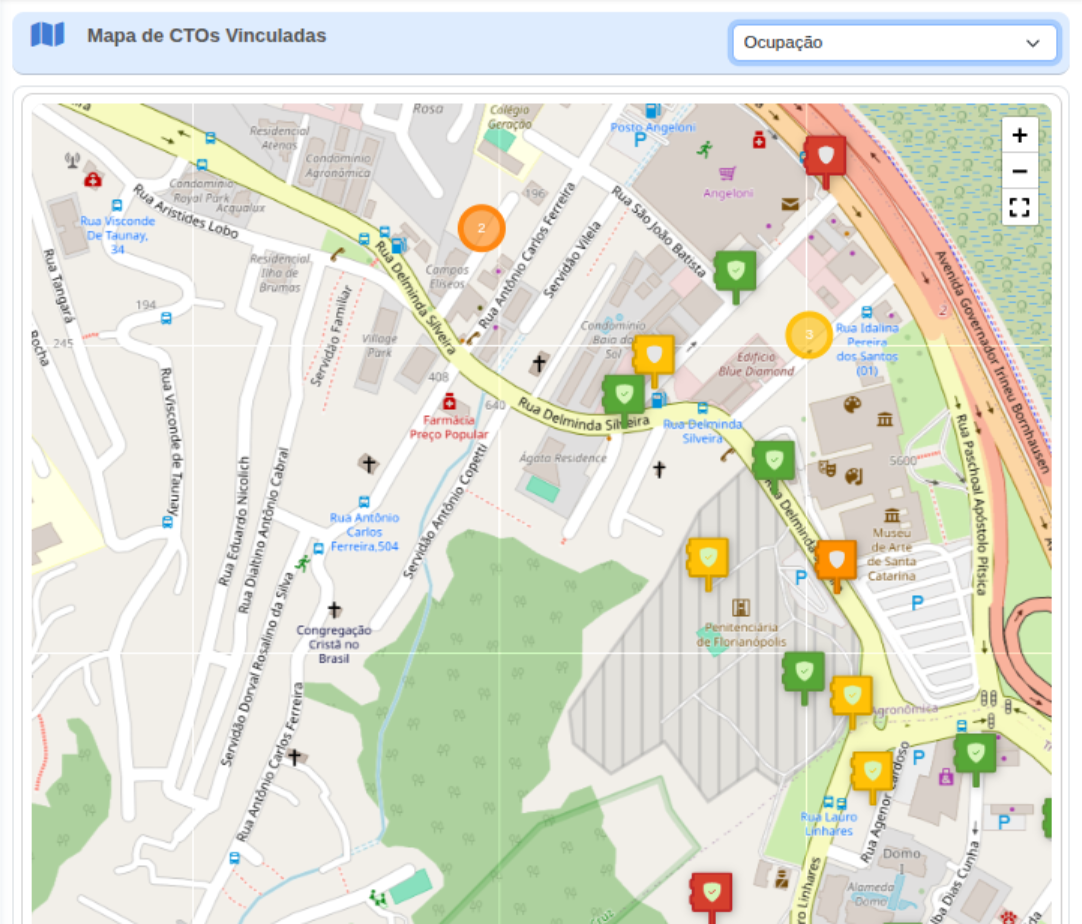
Displays the geographic position of the selected FOTB and surrounding FOTBs.
¶ 🎨 View Modes
- ✔️ Occupancy Mode
- 🛡️ Sanitization Mode
¶ 🎯 Occupancy Color Rules
(Colors preserved exactly as original)
| Color | Occupancy Rate | Description |
|---|---|---|
| Green | < 60% | Low occupancy |
| Yellow | ≤ 80% | Moderate occupancy |
| Orange | < 100% | High occupancy |
| Red | = 100% | Fully occupied FOTB |
¶ 🛡️ Sanitization Rules
- 🟩 Green shield → Sanitized FOTB
- ⬜ Gray shield → Not sanitized FOTB
¶ 📌 Purpose of the Map View
- Identify high-demand FOTBs
- Validate geographic positioning
- Territorial analysis for expansions
- Visual sanitization review
- Detect clustering
- Field planning
¶ 🔄 Import and Reimport FOTB
Manual actions allow forcing synchronization with ERP or GIS.
(All image paths preserved)
¶ 📥 Import FOTB
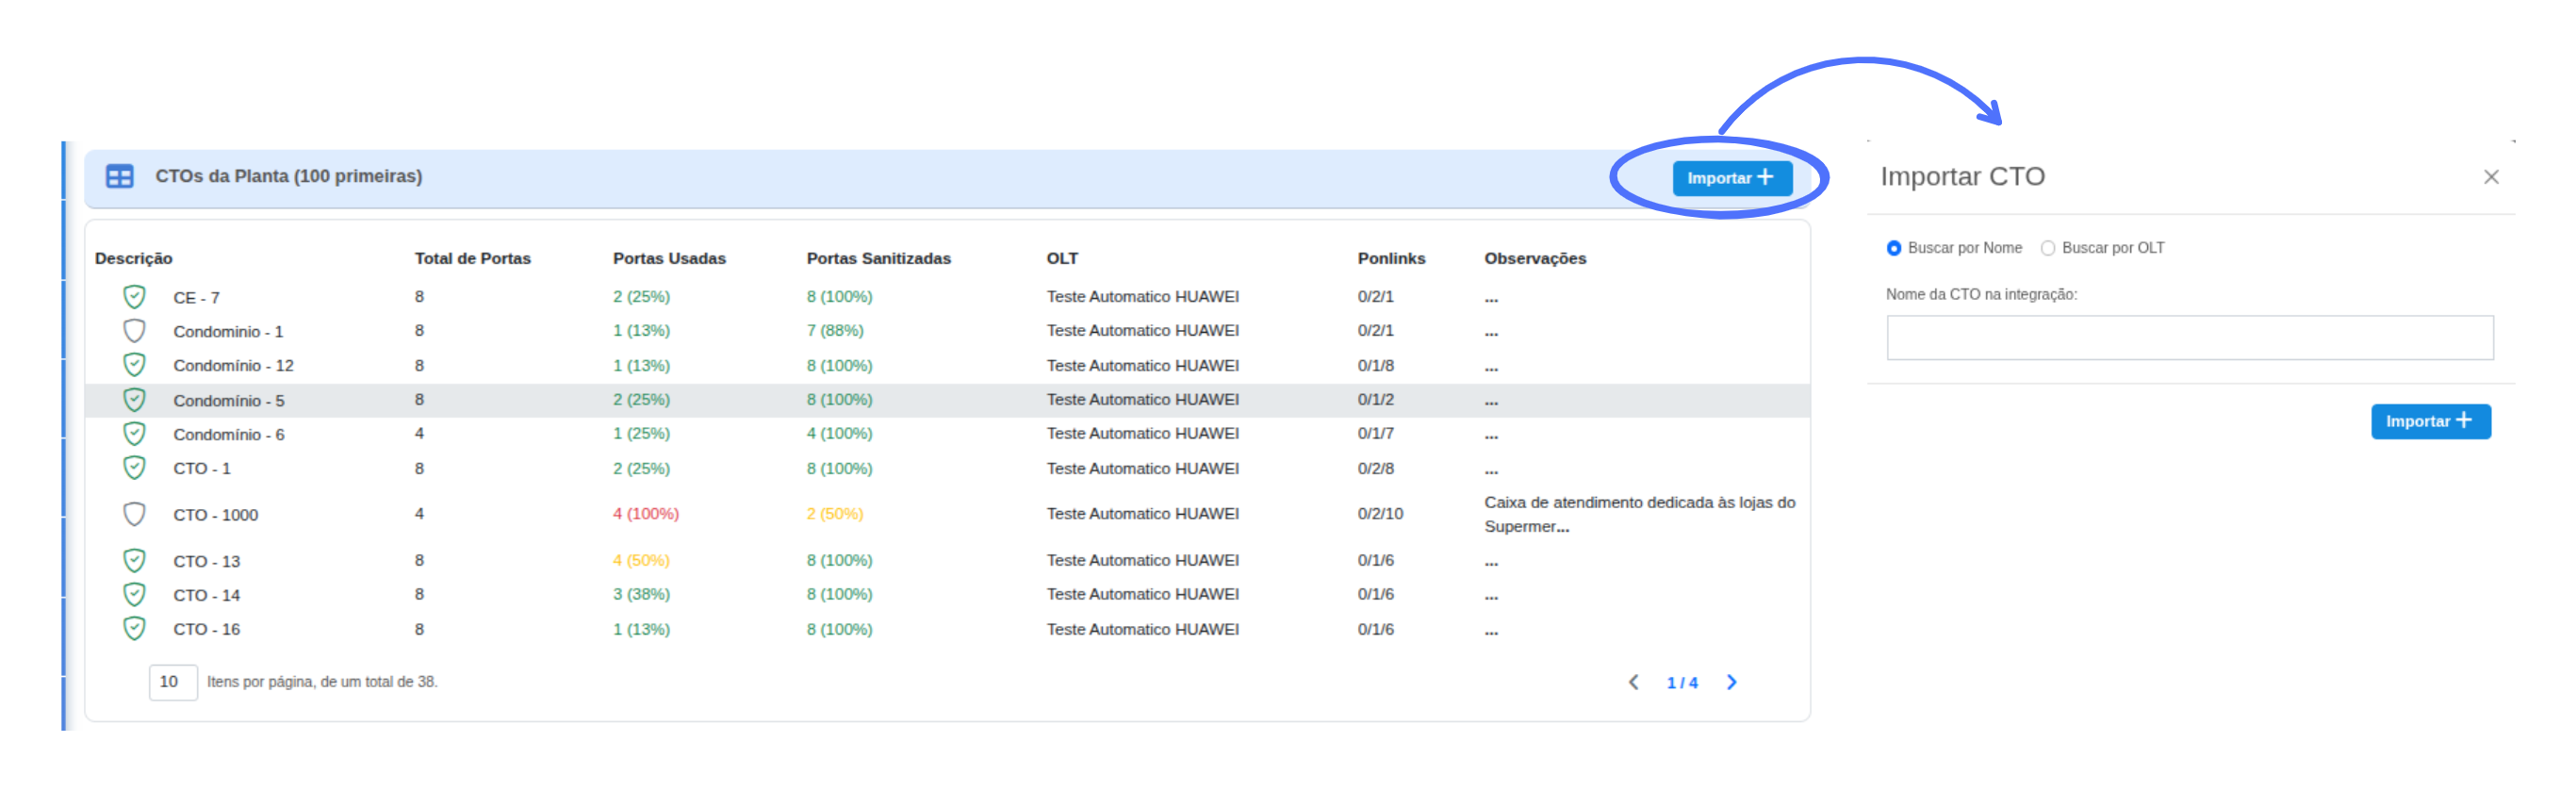
¶ 🔎 1. Search by Name
- Imports a single FOTB
- Updates ports, splitters, location and metadata
¶ 🗂️ 2. Search by OLT
- Imports all FOTBs linked to selected OLT
- Full hierarchy synchronization
¶ 🔄 Reimport FOTB
Forces update of a single FOTB:
- Splitter
- Ports
- OLT/PON link
- Power levels
- FOTB metadata
¶ ✏️ Edit FOTB and Splitter
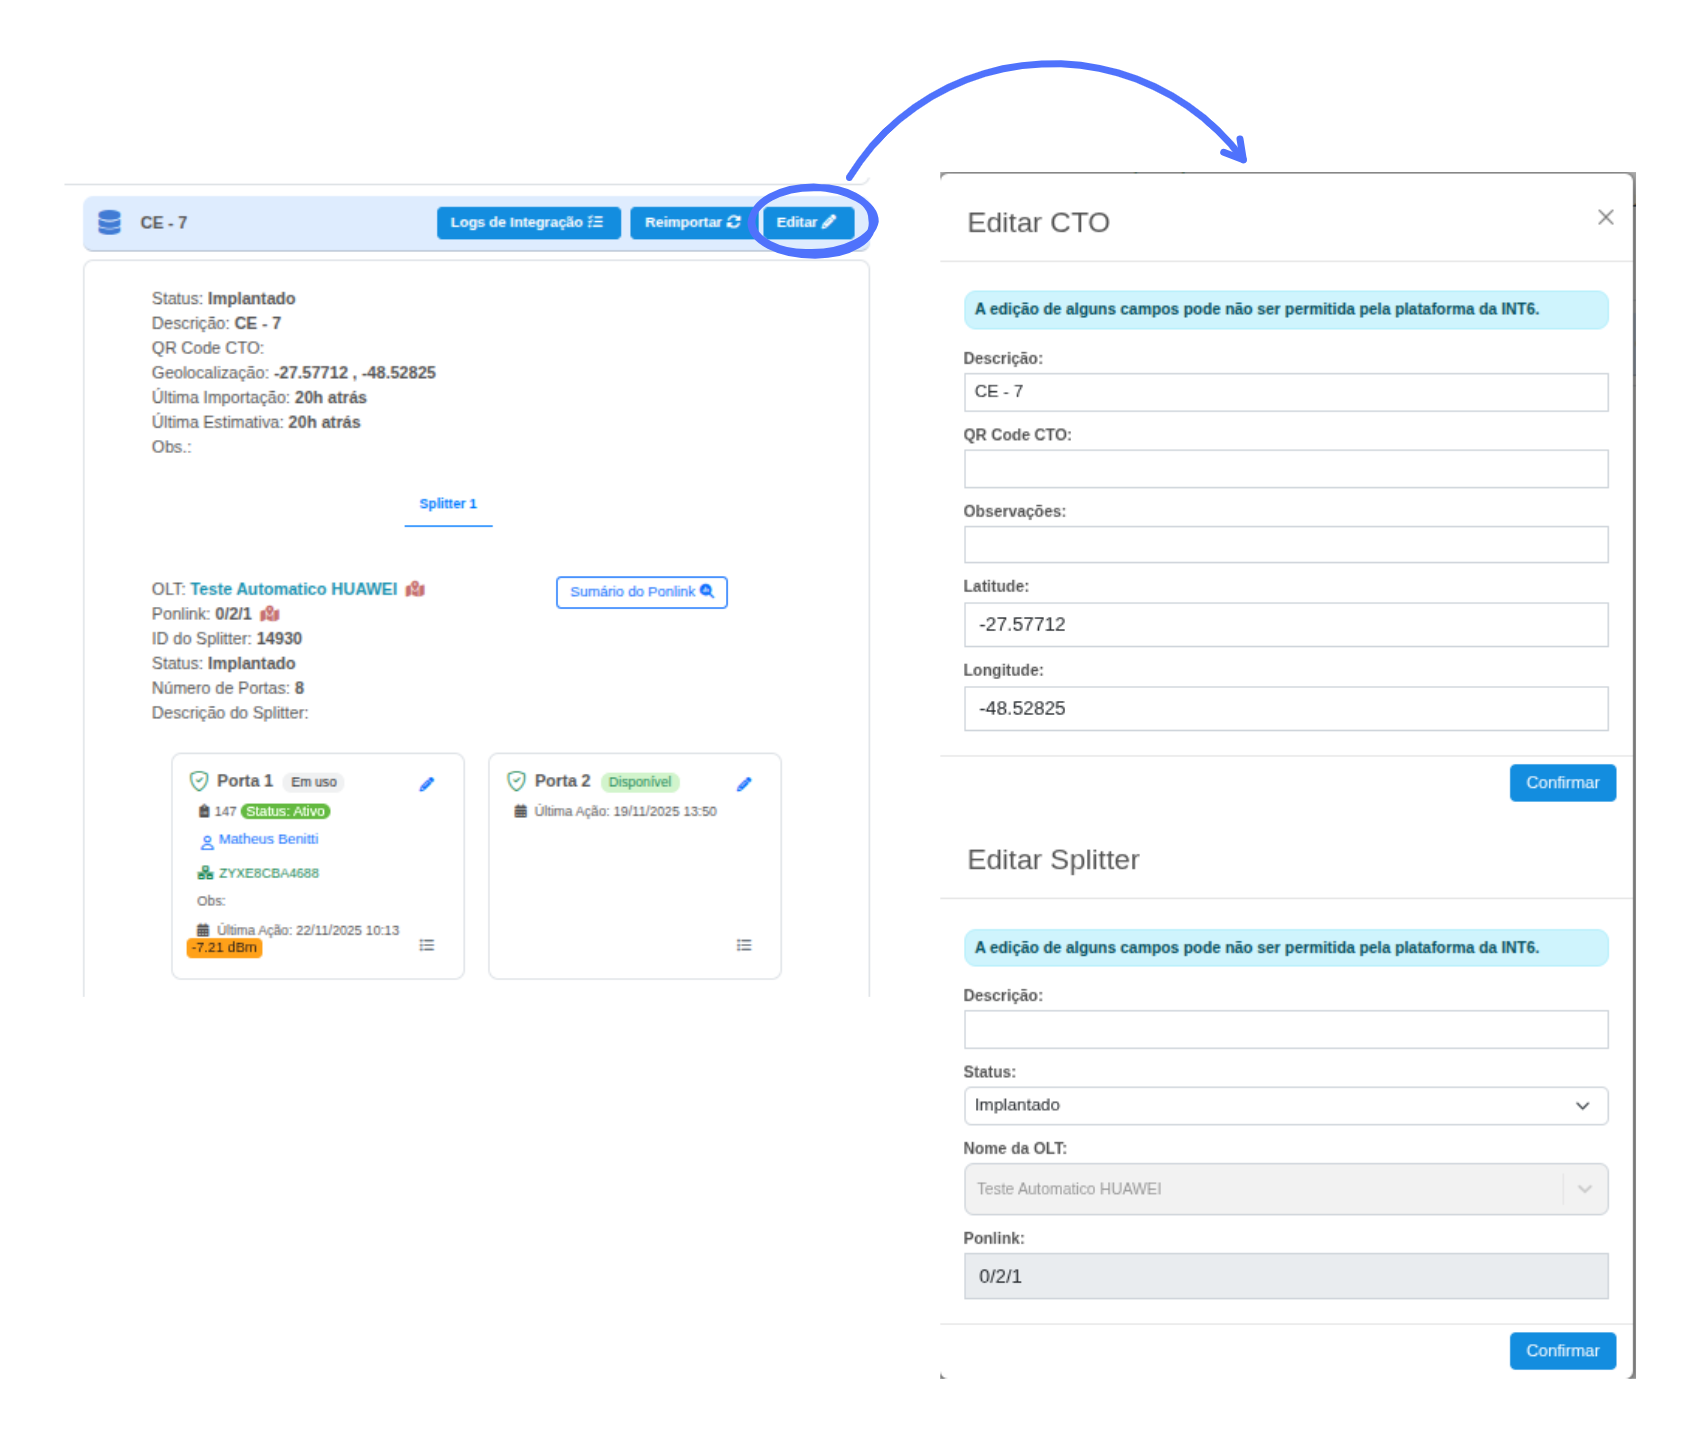
🔔 Attention: Some fields cannot be edited depending on integration permissions.
¶ 🛠️ Edit FOTB Fields
- Description
- FOTB QR Code
- Observations
- Latitude / Longitude
¶ 🛠️ Edit Splitter Fields
- Description
- Status
- OLT Name
- Ponlink
¶ 📚 Conclusion
This screen allows technicians and supervisors to:
- View FOTB structure
- Check used/free ports
- Validate sanitization
- Access optical power
- Perform operational analysis
- Review port history