¶ Massive Events - Overview Dashboard
The Overview dashboard provides a high-level view of the current Massive Events scenario. It summarizes the main event groups in individual cards, allowing operators to quickly identify where active conditions are concentrated before moving to the detailed event dashboards.
The Overview is designed for quick operational assessment. Each card represents an event group and displays its current event count together with additional information relevant to that group.
Use this dashboard to identify which areas currently require attention and then access the corresponding event list for further investigation.
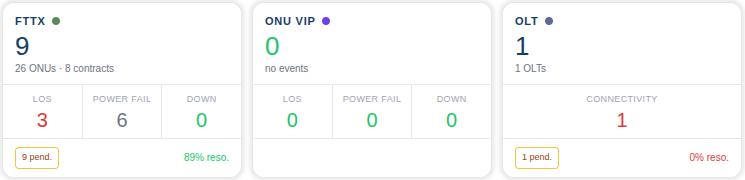
The dashboard is organized into summary cards. Each card represents a specific event group and provides a quick indication of its current status.
| Element | Meaning |
|---|---|
| Card title | Identifies the event group represented by the card. |
| Main number | Shows the number of events currently represented by that category. |
| Type counters | Break down the total according to the event types or monitored conditions available for that group. |
| Status indicators | When available, provide additional information about pending and resolved events. |
The Overview presents separate cards for the main event groups monitored by the Portal. The information displayed inside each card varies according to the characteristics of that group.
The FTTX card summarizes massive connectivity events affecting multiple ONUs in the access network.
The card provides counters for conditions such as LOS, Power Fail, and Down, making it possible to quickly understand which type of connectivity condition is currently affecting subscribers.
The ONU VIP card summarizes events associated with subscribers classified as priority or premium customers.
Its counters help identify whether the affected VIP ONUs are associated with conditions such as LOS, Power Fail, or Down.
The OLT card summarizes connectivity events involving OLTs that are not responding as expected.
The card shows the current number of events and the number of affected OLTs, together with the corresponding Connectivity counter.
A value of 0 indicates that the Overview currently has no events represented for that counter. When events are present, the value changes to reflect the corresponding number of detected conditions.
Some cards also display the number of affected network elements, such as ONUs or OLTs. This helps distinguish the number of events from the number of devices involved.
When available, additional indicators are displayed at the bottom of a card to provide information about event handling.
The pending indicator shows events that still require attention, while the resolution indicator provides a quick view of the proportion of events that have been resolved.
The Overview is most useful as the starting point for Massive Events monitoring. Operators can first identify which event groups contain active conditions and then use the detailed dashboards to investigate individual events.
For event-level analysis and operational handling, continue to the Pending Events, Acknowledged Events, or Archived Events dashboards according to the event status.