ONUs Diagnostics provides a centralized view of subscribers and ONUs that match selected operational, network, and customer criteria. The table can be filtered using a wide range of attributes, making it easier to locate specific subscribers, investigate network conditions, and export information for auditing or further analysis.
By default, the page starts with FTTH applied as the topology filter. Additional filters can be selected according to the information required for the investigation.
Filters can also be customized and saved for future use, allowing frequently used combinations to be reused without configuring the same criteria again.
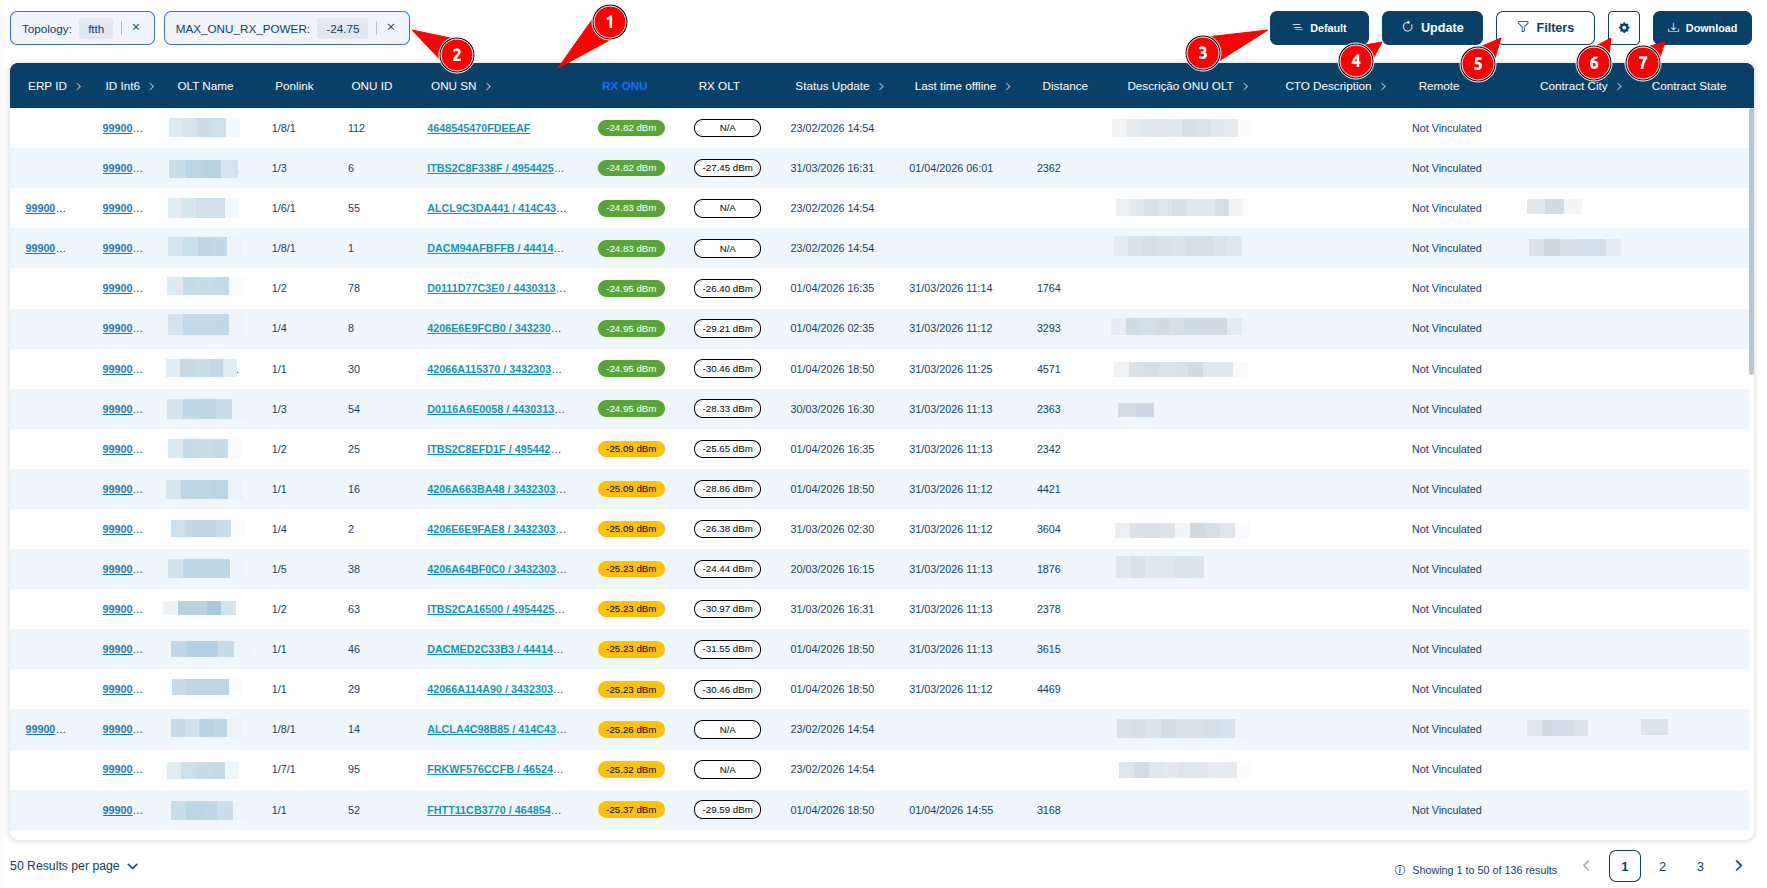
The ONUs Diagnostics screen is organized around the results table and the controls used to filter, update, save, and export its information.
| Item | Element | Purpose |
|---|---|---|
| 1 | Results Table | Displays the subscribers and ONUs that match the currently applied filter criteria, together with the available diagnostic and customer information. |
| 2 | Applied Filters | Shows the filters that are currently active. By default, FTTH is applied as the topology filter. |
| 3 | Saved Filter Name | Shows the name of the filter configuration currently being used. The default configuration is displayed as Default. |
| 4 | Update | Refreshes the table using the current filter configuration. |
| 5 | Filters | Opens the filter selection interface, where the criteria used to narrow down the ONUs Diagnostics results can be selected and applied. |
| 6 | Filter Configuration | Allows customized filter configurations to be managed and saved for future use. |
| 7 | Download | Exports the ONUs Diagnostics table to a CSV file for auditing, external analysis, or record keeping. |
The main table displays the subscribers that match the currently applied filters.
Each row represents a subscriber or ONU that satisfies the selected criteria, while the columns provide the network, subscriber, service, and diagnostic information available for that result.
The information displayed can include identifiers, OLT and PONLink data, ONU information, optical power, service status, location, network topology, and other operational attributes.
The bottom of the page indicates the current result range and the total number of records found.
The Results per page control can be used to change how many records are displayed at once, while the pagination controls allow navigation between pages.
Applied filters appear above the results table, as indicated by item 2 in Figure 1.
When the page is opened with the default configuration, FTTH is applied as the topology filter. Additional filters can be added according to the investigation being performed.
Each active filter is displayed individually, making it possible to quickly identify which criteria are affecting the current results.
Click Filters, identified as item 5 in Figure 1, to select the criteria that should be applied to the ONUs Diagnostics table.
Multiple filters can be combined to progressively narrow down the results. This makes it possible to perform both broad operational searches and highly specific subscriber investigations.
- ERP ID
- Int6 ID
- ONU ID
- ONU Serial Number
- PPPoE Username
- MAC
- OLT Name
- PONLink
- Topology
- Technology
- Splitter
- Remote
- Service Port
- VLAN (from profile)
- ONU Status
- Minimum RX Power at ONU
- Maximum RX Power at ONU
- Minimum RX Power at OLT
- Maximum RX Power at OLT
- ONU Profile Read
- Status Update
- Last Time Offline
- Last Massive
- Massive Begin
- Distance
- ONU OLT Description
- CTO Description
- Contract City
- Contract State
- Address
- Subscriber
- Service Status
- Contracted Plan Identifier
- Partner
- Partner Code
- Partner Description
Filter combinations that are frequently used can be customized and saved for future access.
This prevents operators from having to repeatedly select the same set of filters for recurring diagnostic or auditing tasks.
The control identified as item 3 displays the name of the filter configuration currently in use.
The standard configuration is shown as Default. When a customized filter configuration is selected, its saved name is displayed in this location.
Use the configuration control identified as item 6 to manage customized filter configurations and save combinations that will be reused later.
Saved configurations are especially useful for recurring operational checks that require the same combination of network, subscriber, or service criteria.
The Update control, identified as item 4, refreshes the ONUs Diagnostics results using the currently selected filter configuration.
This allows operators to retrieve the latest available information without changing the active filters.
The Download control, identified as item 7, exports ONUs Diagnostics information in CSV format.
The exported data can be used for auditing, external analysis, operational reports, historical records, or further processing outside the Portal.
The CSV provides the diagnostic and subscriber information available from the ONUs Diagnostics table, allowing the results to be reviewed using spreadsheet or data-analysis tools.
ONUs Diagnostics can be used to locate a specific subscriber, investigate groups of ONUs with similar characteristics, identify network or optical conditions, review subscriber and contract information, and prepare datasets for operational auditing.
For recurring investigations, create and save a custom filter configuration so that the same criteria can be quickly reused in future searches.