¶ 🧭 General Tab – OLT
This section presents a consolidated view of the selected OLT, including operational status, equipment information, monitoring, and slot details.
¶ 🖥️ OLT Overview
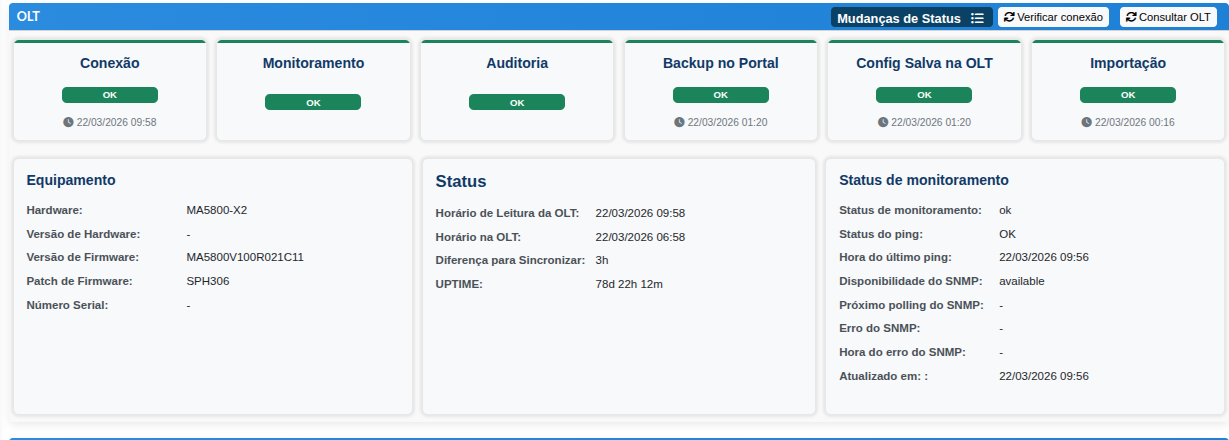
The top section of the screen displays the main OLT indicators:
- Connection → Validates communication with the OLT
- Monitoring → Indicates whether data collection is active
- Audit → Configuration audit status
- Backup in Portal → Indicates whether a backup is saved
- Config Saved on OLT → Configuration status on the OLT
- Import → Last import performed
All items display the current status (OK or error) and the date/time of the last execution.
¶ ⚙️ Equipment Information
This section displays the OLT technical data:
- Hardware
- Firmware Version
- Firmware Patch
- Serial Number
This information is essential for:
- Audits
- Technical support
- Compatibility validation
¶ ⏱️ OLT Status
Displays real-time operational information:
- OLT reading time
- Configured OLT time
- Synchronization difference
- OLT uptime
⚠️ If there is a time difference, it may impact:
- Logs
- Audits
- Synchronizations
¶ 📡 Monitoring Status
Displays the health of communication with the OLT:
- Monitoring status
- Ping status
- Last ping performed
- SNMP availability
- SNMP errors (if any)
💡 This section is essential for identifying communication issues with the OLT.
¶ 🧩 OLT SLOTS
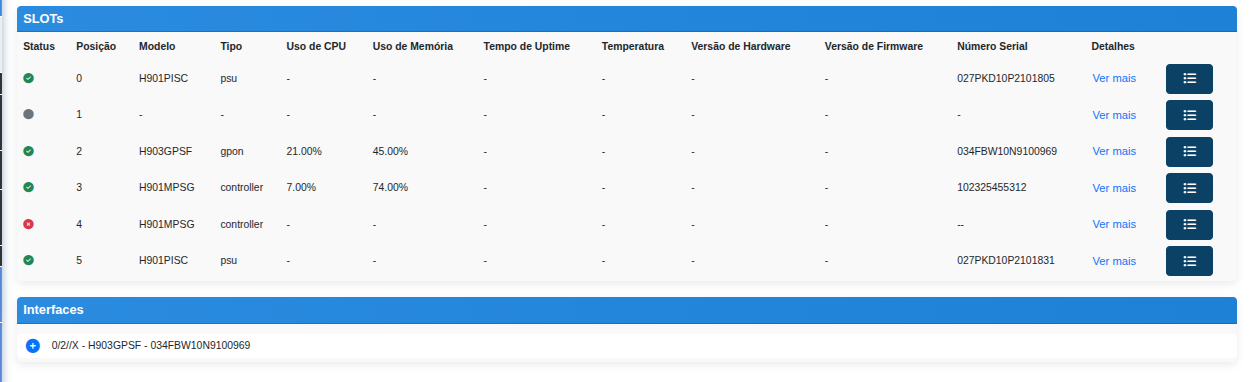
Lists all OLT slots with the following information:
- Position
- Board model
- Type (PON, PSU, Controller, etc.)
- CPU and Memory usage
- Serial Number
- Status (active, inactive, error)
¶ 🔍 Slot Details (View more)
When clicking “View more” in the details column:
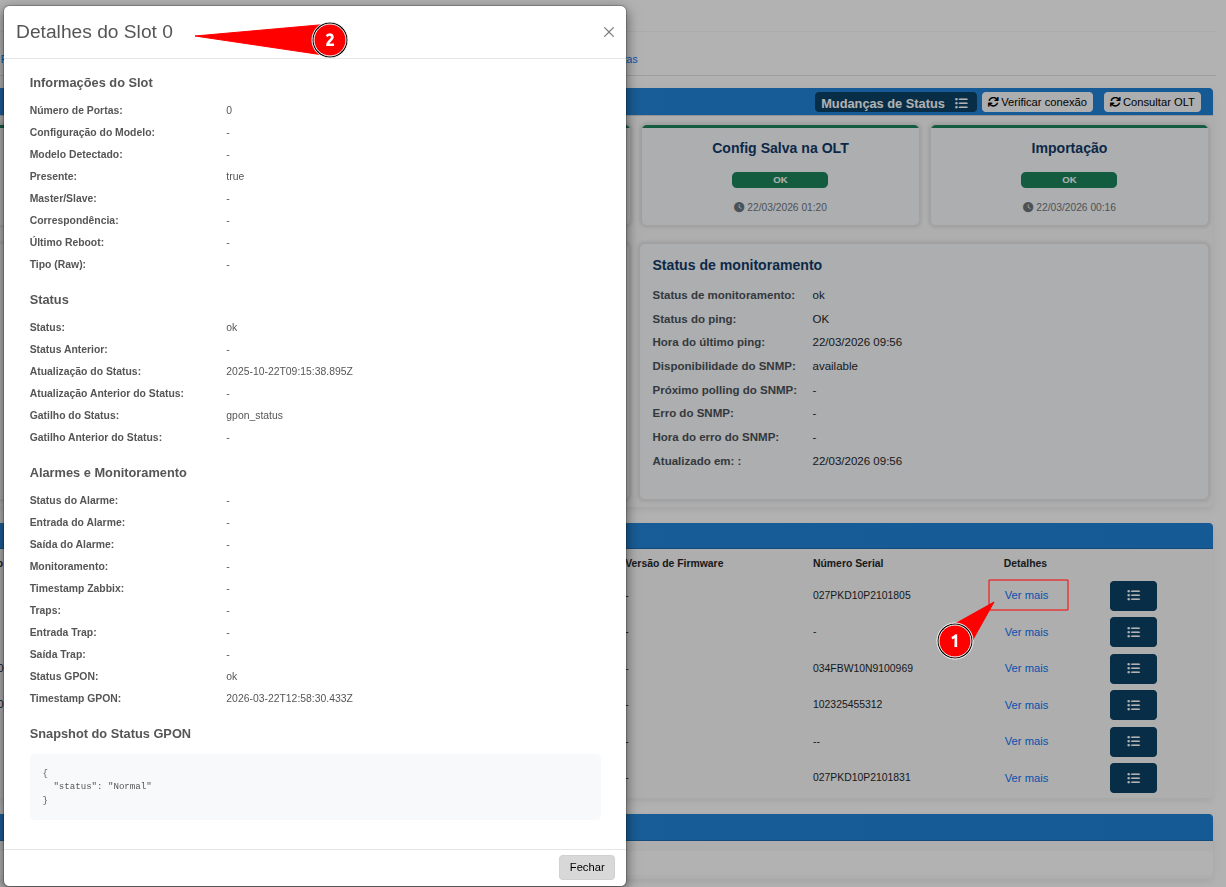
Detailed slot information is displayed:
¶ 📌 Slot Information
- Number of ports
- Detected model
- Presence (true/false)
- Slot type
¶ 📊 Status
- Current status
- Update history
- Trigger responsible for the update
¶ 🚨 Alarms and Monitoring
- Active alarms
- Monitoring
- SNMP and trap information
¶ 📦 PON Status
- PON operational status
- Last update timestamp
¶ 📜 Status Snapshot
Within the slot details, it is possible to view the snapshot:
{
  "status": "Normal"
}