¶ 🧭 View OLT – Information Guide
When accessing the menu PON Infra → OLTs and selecting a registered OLT, the system redirects to the View OLT screen, where all information and configurations related to the equipment are displayed.
¶ 📑 Available Tabs
The available tabs on this screen are:
- Information
- General
- ONUs
- Configuration
- Imported Resources
- FOTBs
- Power Limits
- VLAN Profiles
- Alarms
- Traps
- (D) Raw Traps
- Logs
- Integration Logs
📌 At this moment, we will cover only the Information tab.

¶ 📡 OLT Status
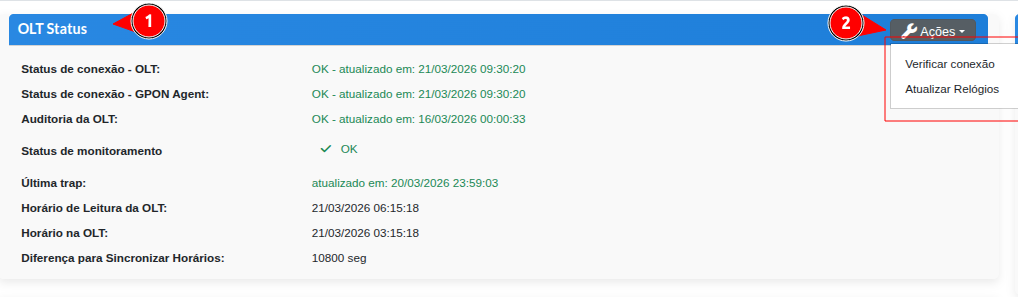
This section presents the overall status of the OLT communication and synchronization.
¶ 🔍 Displayed Information
- Connection status - OLT
- Connection status - PON Agent
- OLT audit
- Monitoring status
- Last received trap
- OLT reading time
- Current OLT time
- Time synchronization difference
¶ ⚙️ Available Actions
In the Actions button, it is possible to:
- 🔄 Check connection with the OLT
- 🕒 Update OLT clock
¶ 🖥️ OLT Information
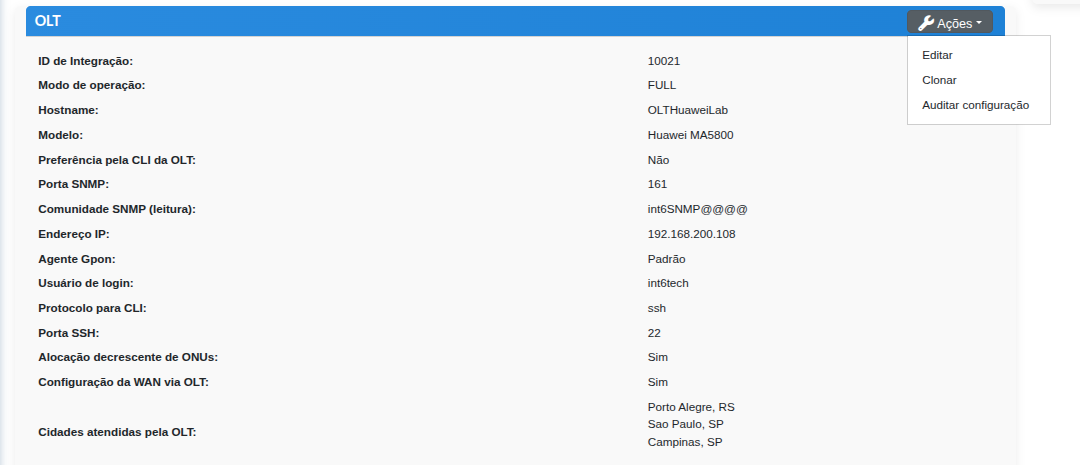
This section displays the registered and technical data of the OLT.
¶ 🔍 Main Fields
- Integration ID
- Operation mode
- Hostname
- Model
- OLT CLI preference
- SNMP port
- SNMP community (read)
- IP address
- PON agent
- Login username
- CLI protocol
- SSH port
- Descending ONU allocation
- WAN configuration via OLT
- Served cities
¶ ⚙️ Available Actions
In the Actions button, it is possible to:
- ✏️ Edit OLT information
- 📄 Clone OLT
- 🔍 Audit configurations
¶ 🟣 ONU by PON LINK
This section shows the number of authorized ONUs per PON Link of the selected OLT.
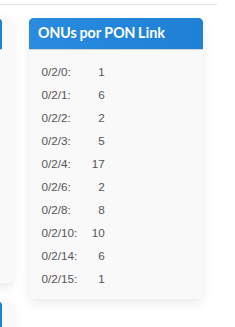
📌 Used for capacity analysis and ONU distribution in the network.
¶ 📌 Notes
- The data displayed on this screen is essential for OLT diagnosis and validation
- It is recommended to check the connection and audit status if there are any provisioning issues
Changes should be made with caution, especially in production environments