¶ 📊 Analytics — Performance Monitoring
The Analytics feature allows you to visually and thoroughly monitor the behavior of equipment connected to the ACS server.
The charts available on this page are periodically updated and display data collected automatically, making it easier for customer service and support teams to analyze network stability, performance, and usage.
💡 Important: data is collected only from devices registered with the TR-069 ACS and with active metrics collection.
¶ 🧭 Accessing the Module
- Access the customer's contract, available on the subscriber index page.
- Select the Analytics tab.
- Wait for the historical charts related to the subscriber's contract to load.
¶ 📶 RSSI — Wi-Fi Signal Strength
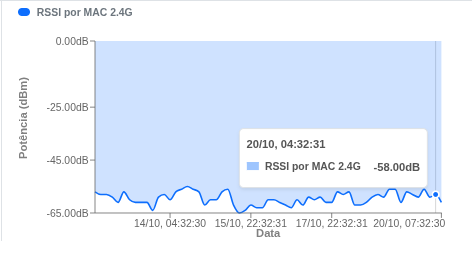
The RSSI charts indicate the Wi-Fi signal power level over time.
| Metric | Description |
|---|---|
| RSSI by MAC 2.4G | Displays the individual signal level of each connected device. |
| Average / Worst RSSI 2.4G | Shows the average behavior and the lowest signal value over time. |
| Average / Worst RSSI 5G | Same as above, but for the 5 GHz band. |
🔹 Signals between -30 and -65 dBm are considered good.
🔹 Signals below -80 dBm indicate quality degradation.
¶ 💾 CPU and Memory Usage
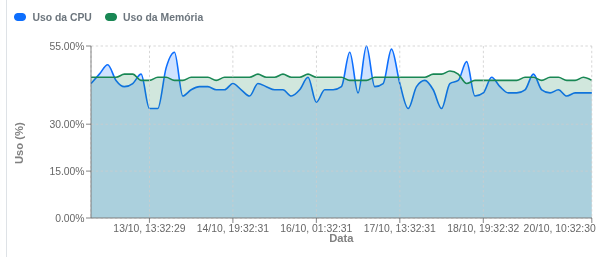
This data helps identify hardware overload or system freezes.
| Metric | Description |
|---|---|
| CPU Usage | Percentage of CPE processing capacity in use. |
| Memory Usage | Percentage of RAM currently used by the system. |
¶ 🌡️ Equipment Temperature
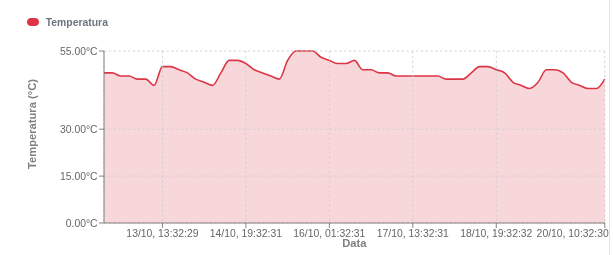
The chart shows variations in the internal temperature of the optical transceiver.
- Typical values range between 30 °C and 55 °C.
- Above 60 °C, it is recommended to check ventilation and exposure to direct sunlight.
¶ 🔌 Optical Power (ONU)
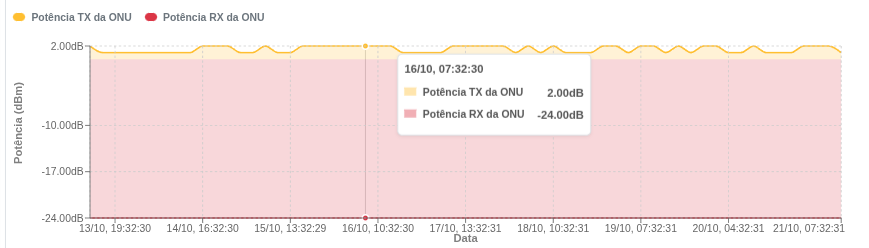
| Parameter | Description |
|---|---|
| ONU TX Power | Power level transmitted by the ONU (output). |
| ONU RX Power | Received power level (optical signal input). |
¶ 🕓 Uptime
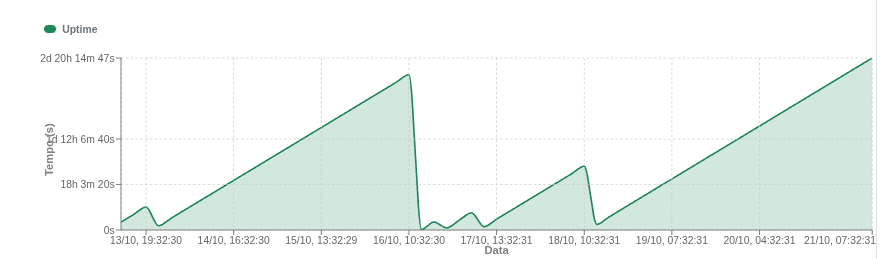
- Increasing chart: indicates continuous and stable operation.
- Uptime drops: may indicate power failures, firmware issues, or overheating.
¶ 📡 Connected Devices
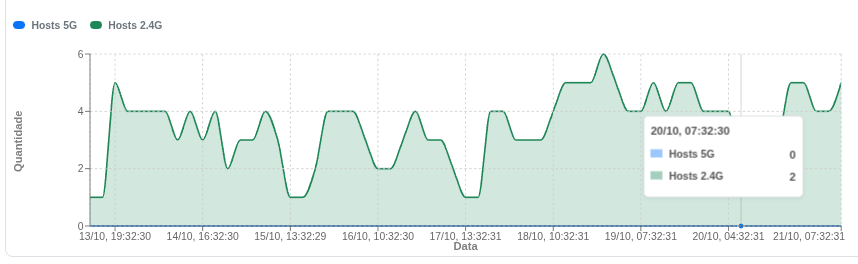
| Band | Description |
|---|---|
| 2.4G Hosts | Devices connected to the 2.4 GHz network. |
| 5G Hosts | Devices connected to the 5 GHz network. |
¶ 🗑️ Dropped Packets
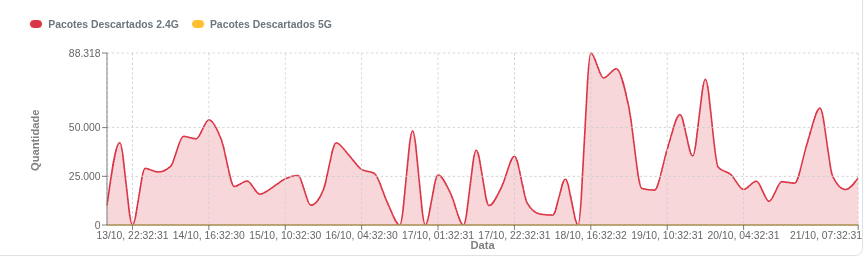
Displays the number of data packets dropped during transmissions.
- 2.4G: Drops caused by interference or collisions.
- 5G: Drops caused by signal instability.
¶ 🌐 Bandwidth Usage
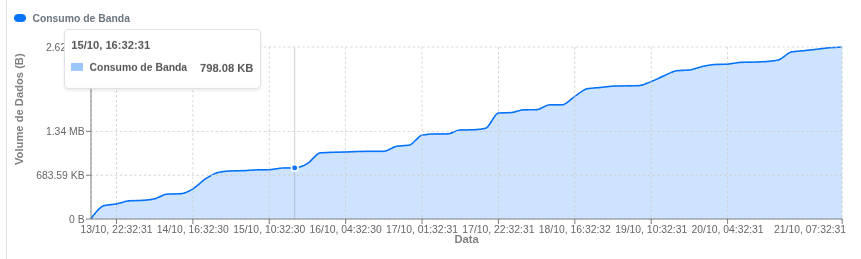
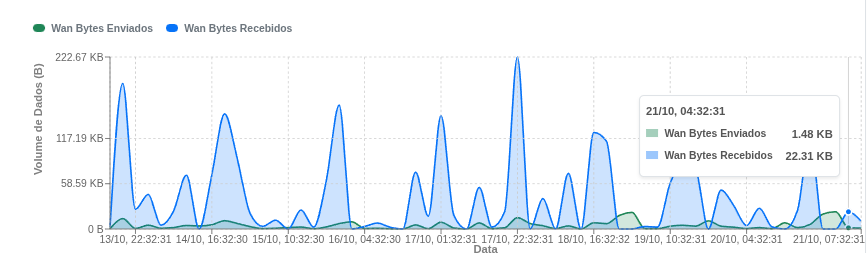
| Metric | Description |
|---|---|
| WAN Bytes Sent | Amount of data transmitted by the ONU. |
| WAN Bytes Received | Amount of data downloaded from the network. |
¶ 🧠 Technical Interpretation
| Indicator | Ideal Range | Notes |
|---|---|---|
| RSSI 2.4G / 5G | -30 to -65 dBm | Best signal performance |
| CPU / Memory | Up to 70% | Avoid peaks above 90% |
| Temperature | Up to 55°C | Above 60°C requires attention |
| Dropped Packets | Ideal: < 5% | Drops above 5% require analysis — they may indicate packet loss. |
| RX/TX Optical Power | -23 to -10 dBm | The optical design and the sensitivity of the OLT/ONU modules must be taken into account. |
¶ 🧩 Conclusion
Analytics is a continuous CPE performance monitoring tool that makes it possible to:
- Identify hardware failures and network instability.
- Detect Wi-Fi interference and optical power loss.
- Monitor resource usage and bandwidth consumption.
- Provide a technical basis for remote and preventive diagnostics.
🔹 All charts are updated based on data sent by the device through the TR-069 ACS.
🔹 If the message “No data received from ACS” is displayed, check whether the device is online and synchronized with the server.