¶ 🧪 Concentrator Diagnostics (Juniper)
The Concentrator Diagnostics is an advanced feature of the Int6 portal, available exclusively for Juniper concentrators, allowing real-time monitoring of the subscriber session status, bandwidth consumption, PPPoE connection history, and technical information of the edge equipment.
This feature is widely used by NOC, Support, and Engineering, helping analyze slowness, recurring disconnections, unexpected usage, and validation of active sessions.
¶ ⚠️ Feature Availability
🔒 Important
The Concentrator Diagnostics module is available only for Juniper devices, due to integration via NETCONF.
Devices from other vendors do not display this tab in the portal.
¶ 🖥️ Screen Overview
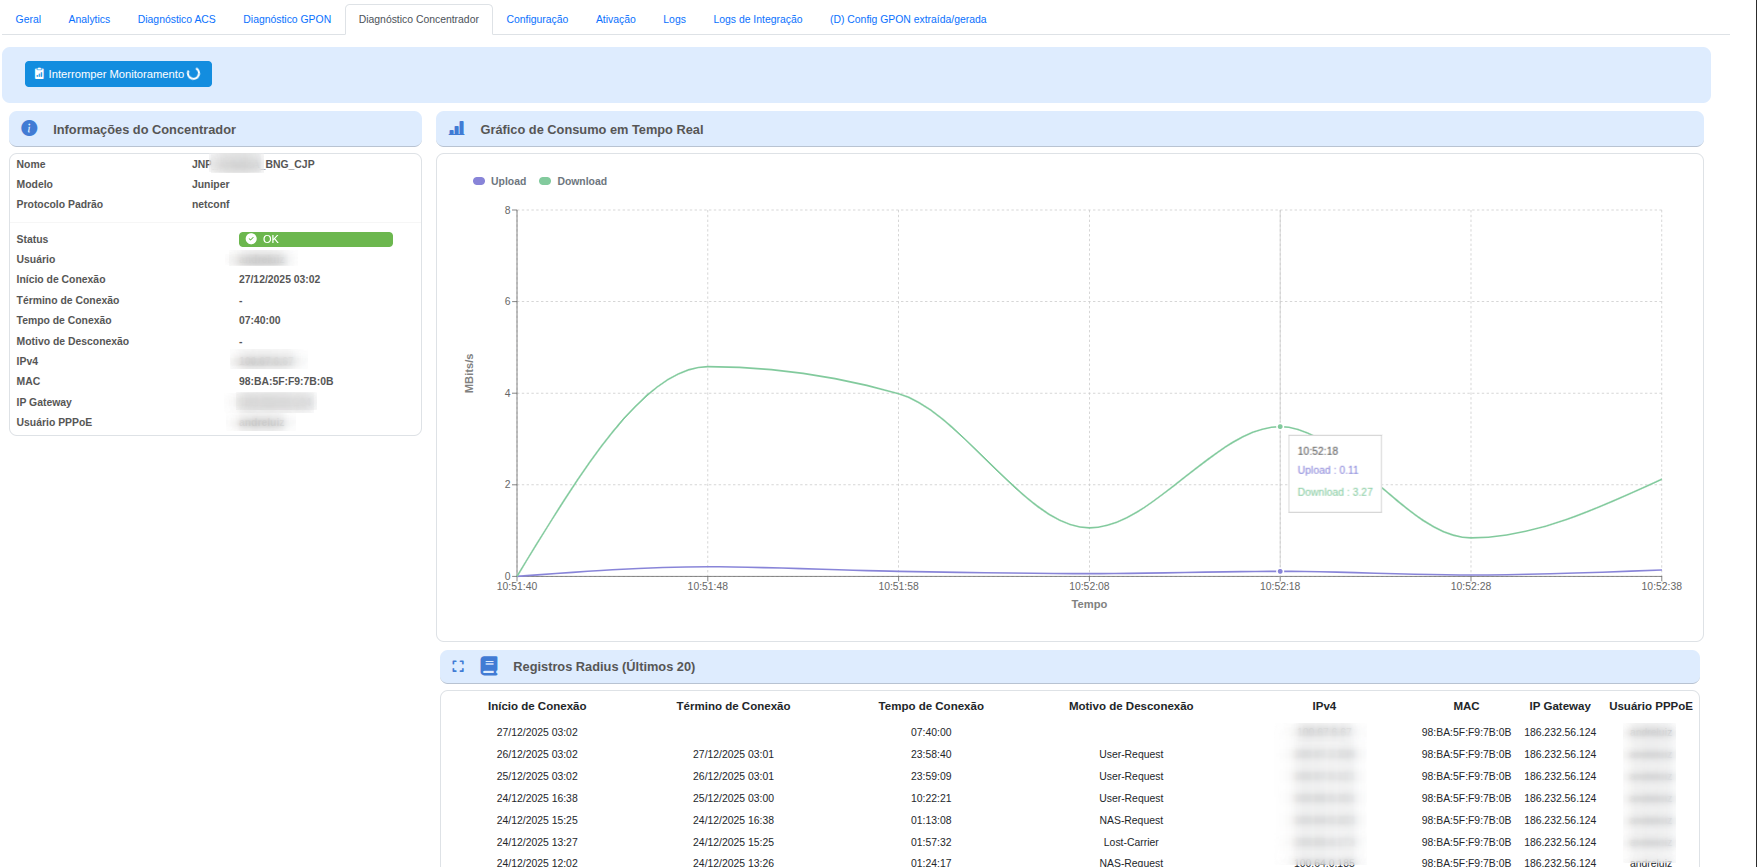
The screen is divided into three main sections:
- Concentrator Information
- Real-Time Consumption Graph
- Radius Records (Latest Connections)
¶ 📡 1️⃣ Concentrator Information
This panel displays the technical data of the active session on the Juniper concentrator.
| Field | Description |
|---|---|
| Name | Concentrator identification (e.g., BNG_CJP). |
| Model | Device manufacturer (Juniper). |
| Default Protocol | Communication protocol used (NETCONF). |
| Status | Session state on the concentrator (OK / Disconnected). |
| User | Authenticated user in the PPPoE session. |
| Connection Start | Date and time when the session was established. |
| Connection Time | Current duration of the active session. |
| IPv4 | IP address assigned to the subscriber. |
| MAC | MAC address of the authenticated CPE/ONU. |
| Gateway IP | Gateway used by the subscriber. |
| PPPoE User | PPPoE login associated with the session. |
¶ 📊 2️⃣ Real-Time Consumption Graph
The graph displays the instant bandwidth usage of the subscriber:
- 🔵 Upload
- 🟢 Download
- Scale in Mbps
- Continuous updates while monitoring is active
¶ Key features:
- Visualization of consumption peaks
- Identification of idle or constant traffic
- Support in analyzing perceived slowness
▶️ The "Stop Monitoring" button ends real-time data collection when needed.
¶ 📜 3️⃣ Radius Records (Last 20)
This panel shows the recent PPPoE connection history, helping identify drops, reconnections, and abnormal behavior.
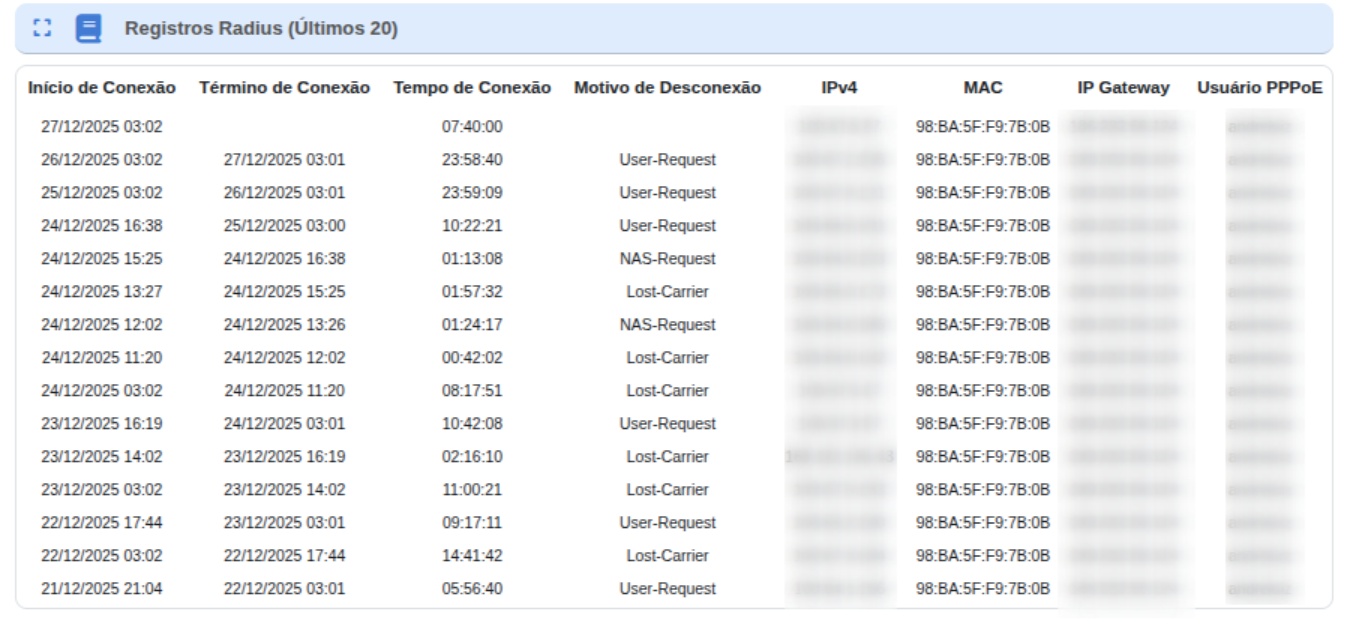
¶ Common disconnection reasons:
- User-Request → Disconnection initiated by the user or device
- NAS-Request → Disconnection requested by the concentrator
- Lost-Carrier → Signal loss or physical failure
¶ ✅ Benefits of Concentrator Diagnostics
✔ Fast analysis of active sessions
✔ Full visibility of real-time consumption
✔ Detailed PPPoE disconnection history
✔ Reduced need for field dispatch
✔ More accurate technical support
¶ 📌 Final Notes
- Feature exclusive to Juniper
- Requires active NETCONF integration
- Ideal for NOC, L2/L3 Support, and Engineering
🧠 This diagnostic complements PON Diagnostics and Activation Logs modules, providing a complete view of the subscriber experience.