¶ ⚡ ONU RX Signal Strength
The ONU RX Signal Strength section displays the variation of the received optical power (dBm) directly at the ONU/ONT, allowing you to track signal behavior over different time intervals.
These charts are essential for identifying intermittent losses, connection failures, and power fluctuations that may impact the customer's internet stability.
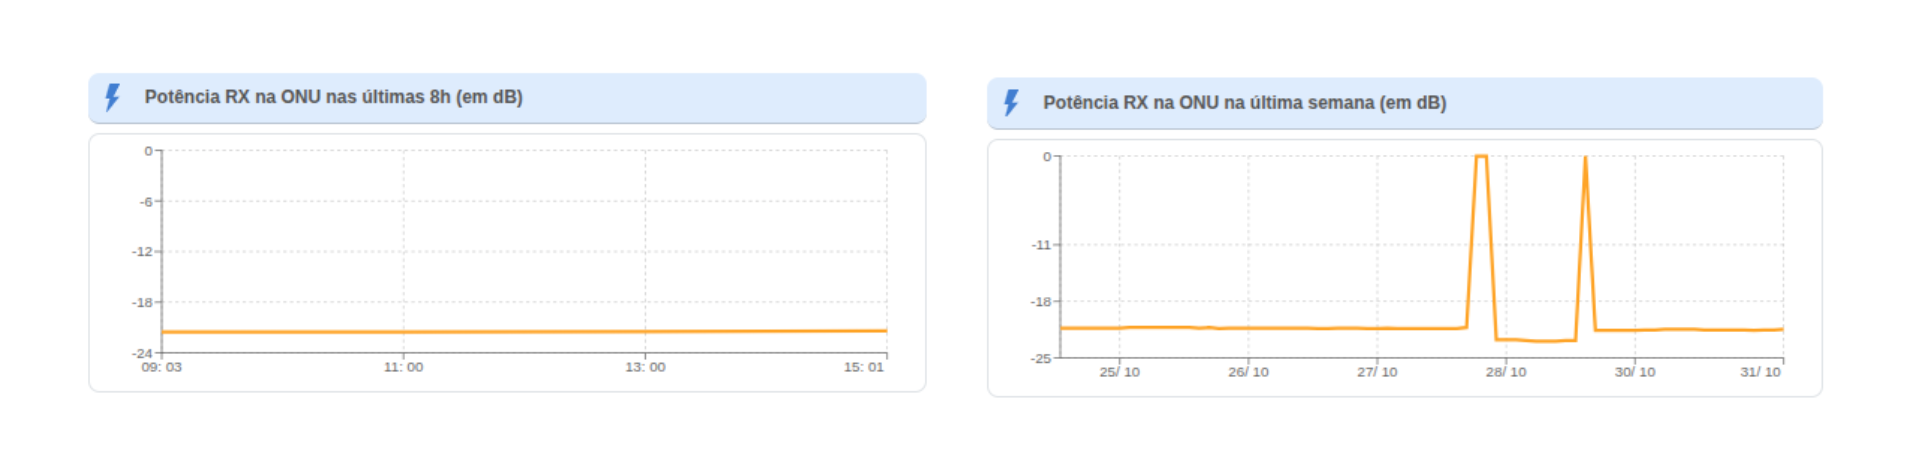
¶ 📊 Overview
The panel displays two complementary charts of received optical power (RX) readings:
- Last 8 hours — real-time analysis for detecting immediate drops or spikes.
- Last week — consolidated history, useful for observing patterns and recurring instabilities.
Both charts allow a quick analysis of the customer's optical stability, correlating outage times with possible maintenance events or field failures.
¶ ⏱️ RX Signal Strength – Last 8 Hours
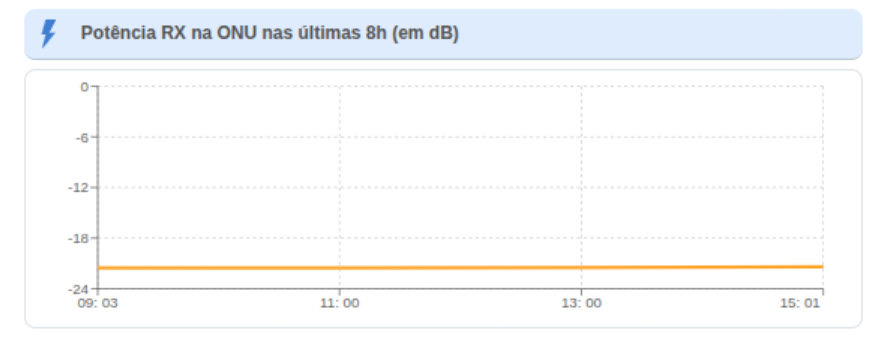
Displays the RX signal strength over the last 8 hours, with continuous updates and a focus on short-term variations.
Ideal for monitoring during support calls or field tests.
📘 Interpretation:
- Steady line → stable and healthy link.
- Sudden drops → possible disconnection, poor contact, or connector attenuation.
- Reading near -24 dBm → weak signal, risk of synchronization loss.
¶ 📅 RX Signal Strength – Last Week
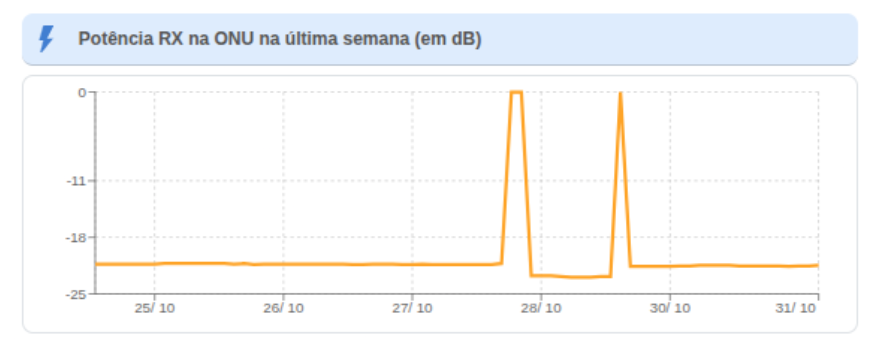
Shows the behavior of optical power over the last 7 days, allowing you to identify degradation trends and recurring signal loss events.
💡 Technical tip:
Positive spikes (near 0 dBm) generally indicate moments when the ONU was offline or had no valid optical reading.
¶ 📈 Key analyses possible:
- Daily oscillations → indicate physical instability in the drop or connector.
- Recurring drops → intermittent failures or partial fiber break.
- Steady line → intact fiber and stable connection.
¶ ✅ Analysis Best Practices
- Always compare the 8-hour and weekly charts to understand whether the variation is isolated or recurring.
- Rapid oscillations generally indicate a poorly seated connector or local interference.
- Check whether the behavior coincides with automatic re-readings or maintenance events.
- Use the chart alongside the PON Diagnostics screen to confirm whether there is a real communication loss.