¶ Service Desk Screen
¶ Subscriber Details
This screen provides a general and detailed overview of the status and settings of a specific subscriber.
¶ Overview

At the top, you will find the subscriber's basic information, such as Subscriber ID, Contract ID, Installation Address, and Service Status.
¶ Warnings and Diagnostics

The central area displays important alerts, such as "Auto-diagnosis: No learned MAC..." and "Optical signal out of operating limits...", indicating possible connection issues.
¶ Actions and Tools

A toolbar offers quick action buttons for diagnostics and management:
- Auto-diagnosis: Runs an automatic connection diagnostic.
- Realtime Bandwidth: Real-time bandwidth measurement.
- Reboot via OLT: Remotely restarts the subscriber's equipment (ONU).
- Analytics: Access to service analytics data.
- Refresh: Reloads the information displayed on the page.
¶ Information Panels
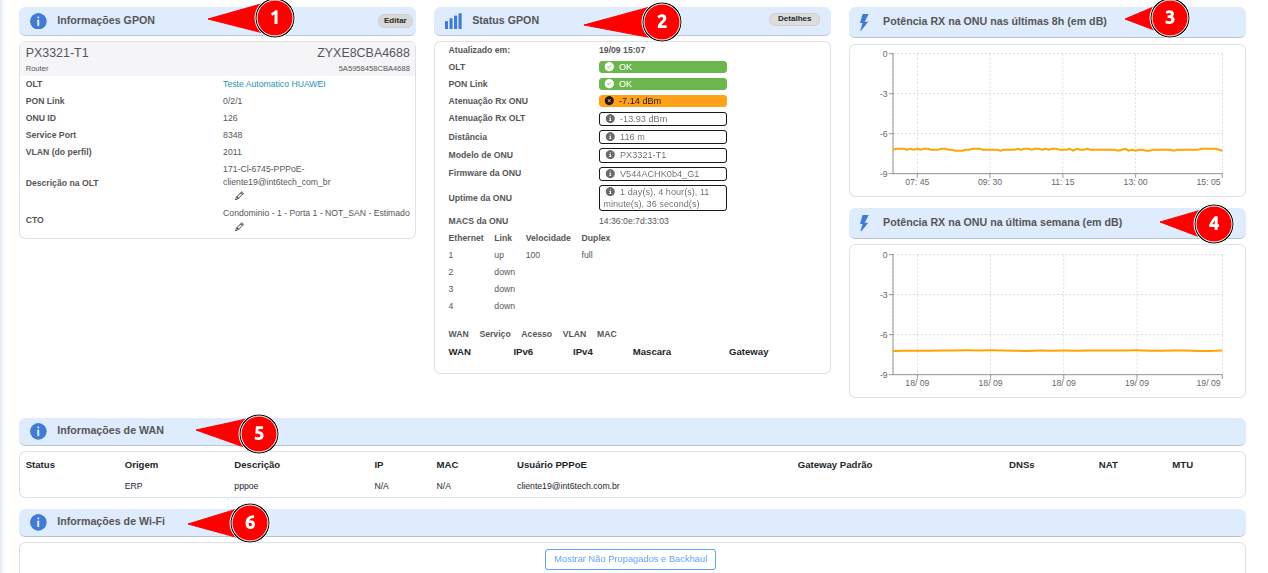
The screen is divided into several panels that provide detailed information about different aspects of the service:
- PON Information: Technical data about the PON connection, such as ONU ID, VLAN, and OLT Description.
- PON Status: Shows the current connection status, including OLT Status, PON Link, and attenuation levels (OLT RX Attenuation and ONU Attenuation).
- ONU RX Signal Strength: Charts that monitor the signal power received (RX) by the subscriber's equipment over the last 8 hours and the past week.
- WAN Information: Details of the WAN (Wide Area Network) configuration.
- Wi-Fi Information: The subscriber's Wi-Fi network settings and status.
- Router Information: Router data, such as model and firmware version.
- Devices Connected to the Internal Network: Lists the devices currently connected to the subscriber's network.
- Wi-Fi Mapping at Subscriber's Home: Visualization of the Wi-Fi coverage mapping at the subscriber's residence.
- Port Mapping: Port forwarding settings.
Each of these panels has a specific purpose and provides access to important details for subscriber diagnostics and support.