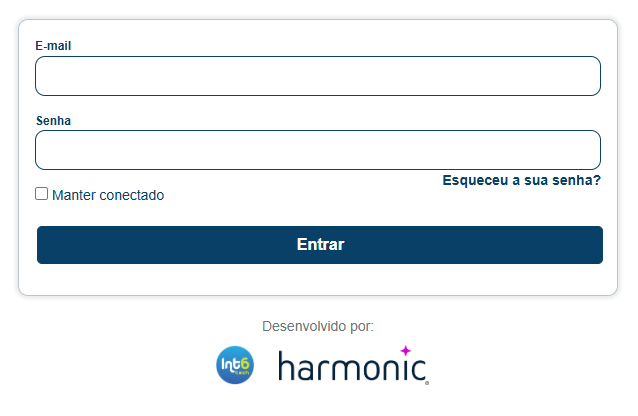
We welcome the new phase of the Portal with a modernized access experience aligned with our new brand.
To reflect our evolution as part of Harmonic, we updated the login screen with the new "A Harmonic Company" icon and applied the latest design guidelines.

|
|
¶ 🆕 New Features
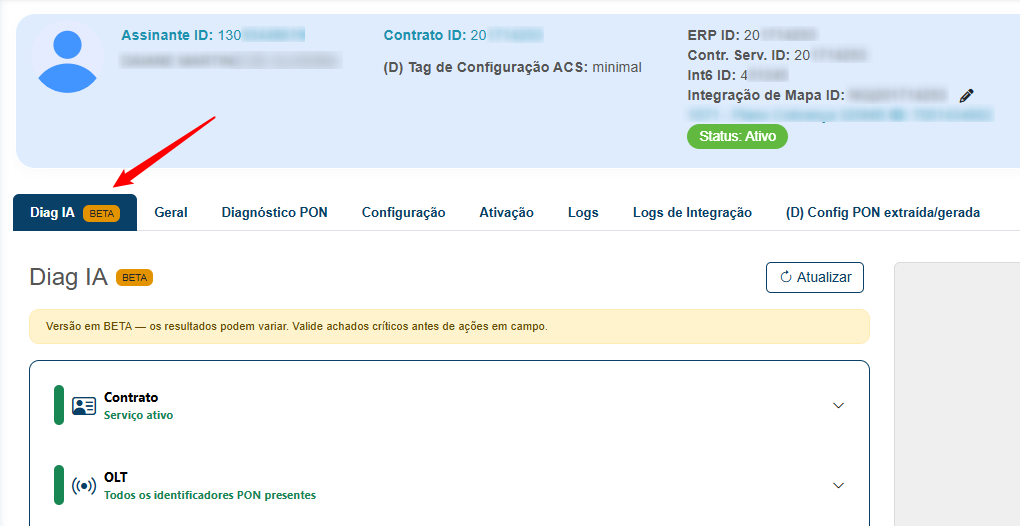
¶ 1. Smart Diagnostics on the Subscriber Screen
We raised the level of technical support with the automatic release of our Smart Diagnostics tool for all users.
¶ 2. Release of the CTO Sanitization Screen
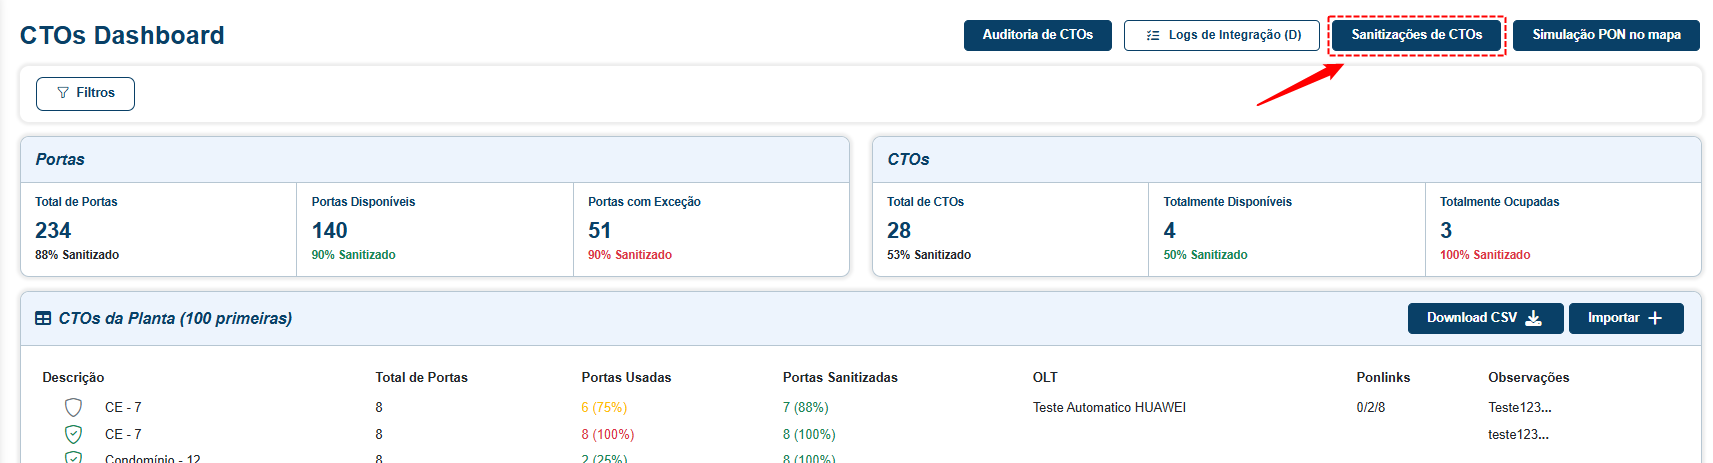
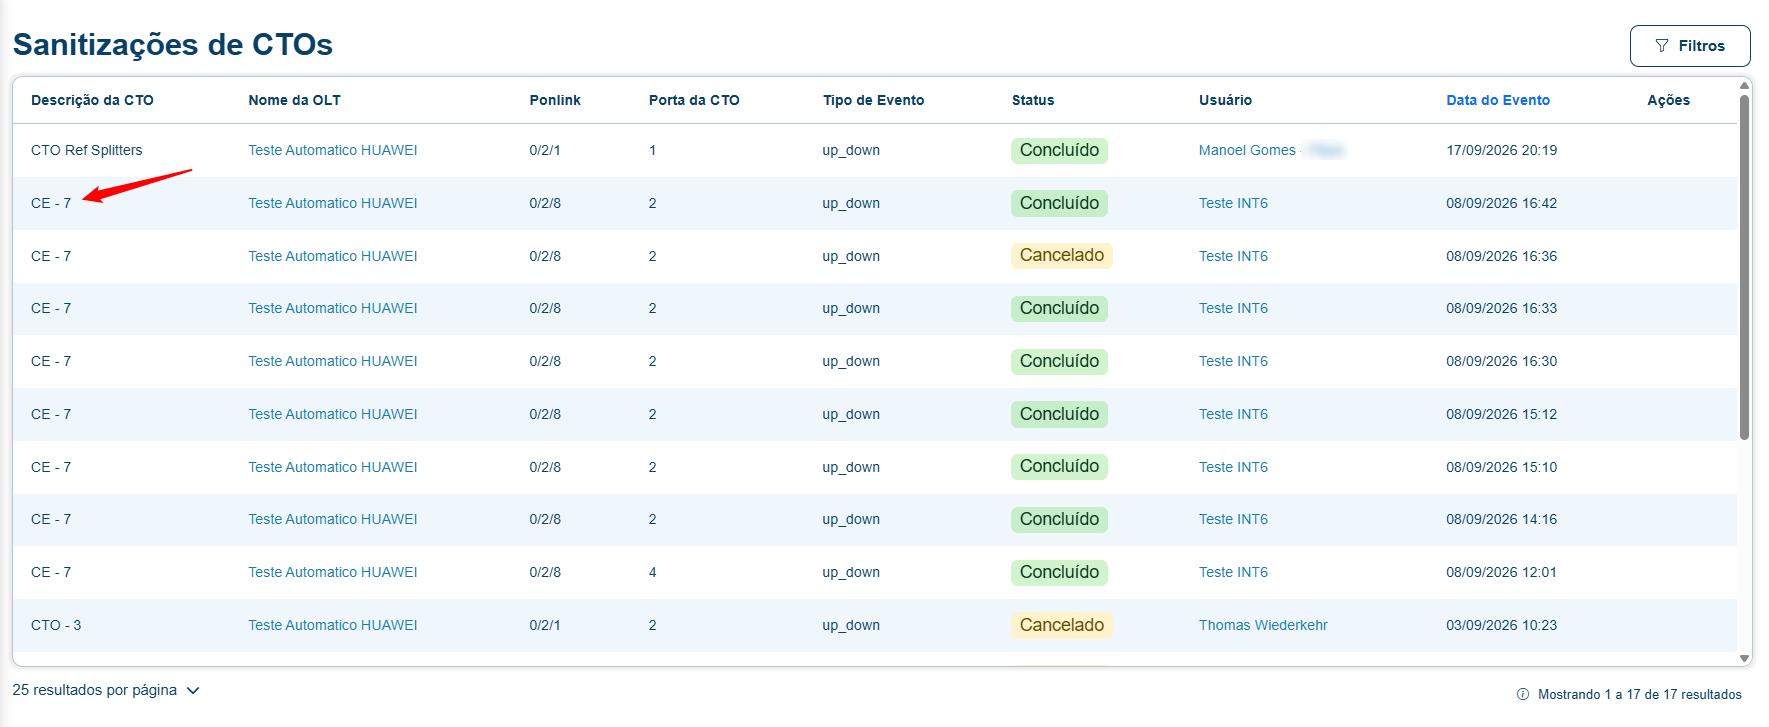
Removal of the access restriction to the CTO sanitization screen. Now, the screen with the sanitization records is available to end users, accessible through the CTO dashboard, "CTO Sanitization" button.
Screen with records of sanitizations already completed and/or in progress. To access the details, simply click on the CTO description.
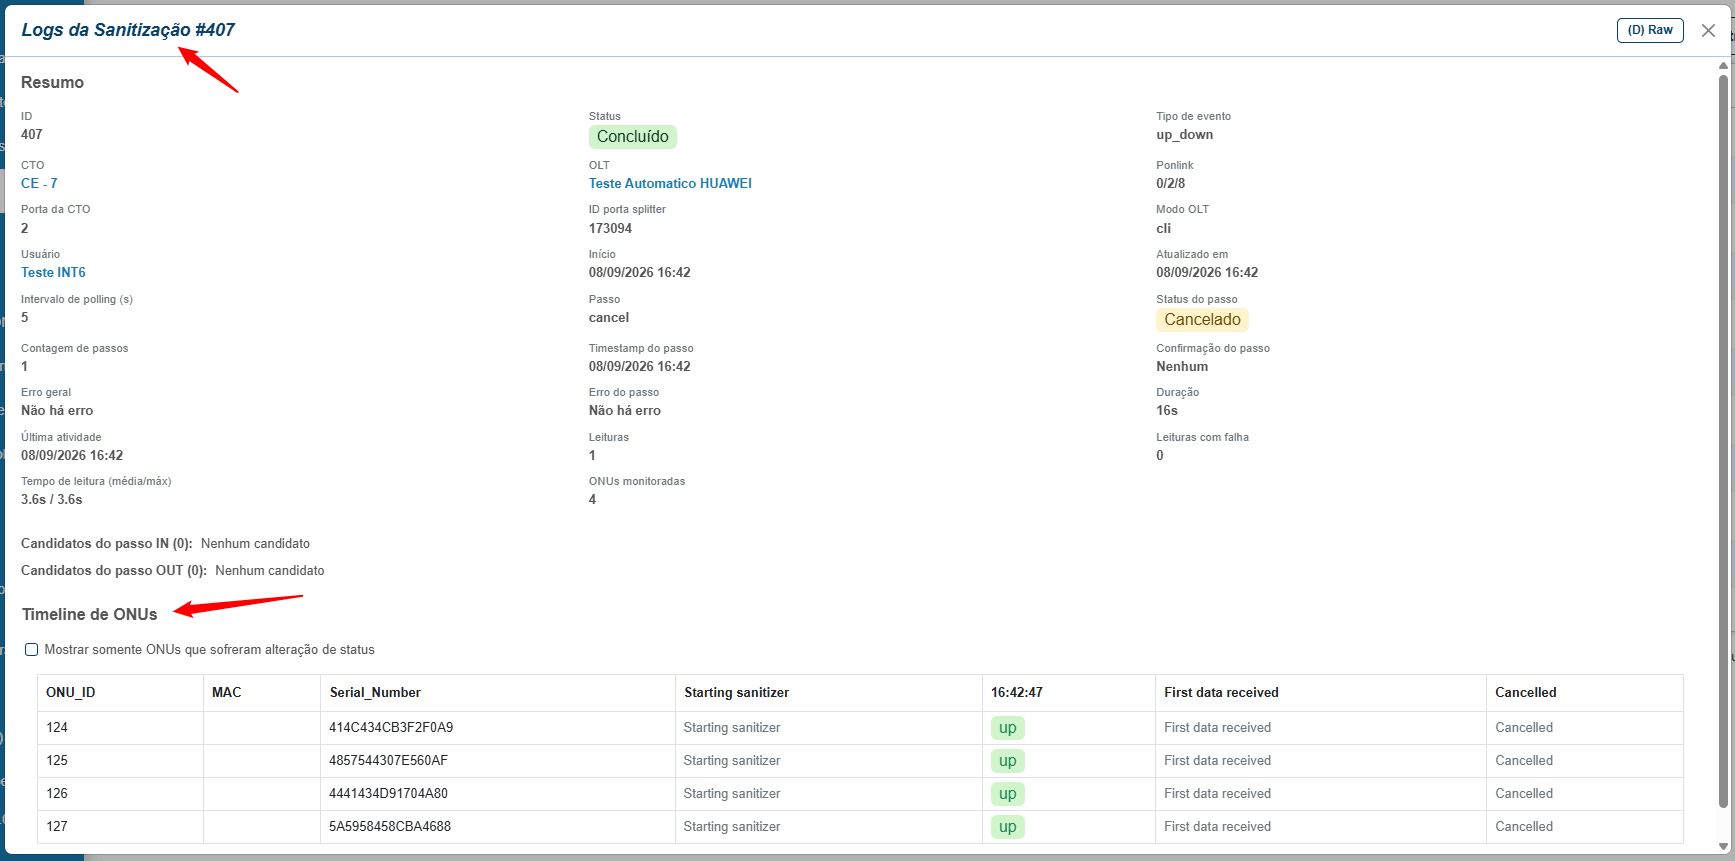
Screen with more details of the selected sanitization.
¶ 3. OLT Manager Interface
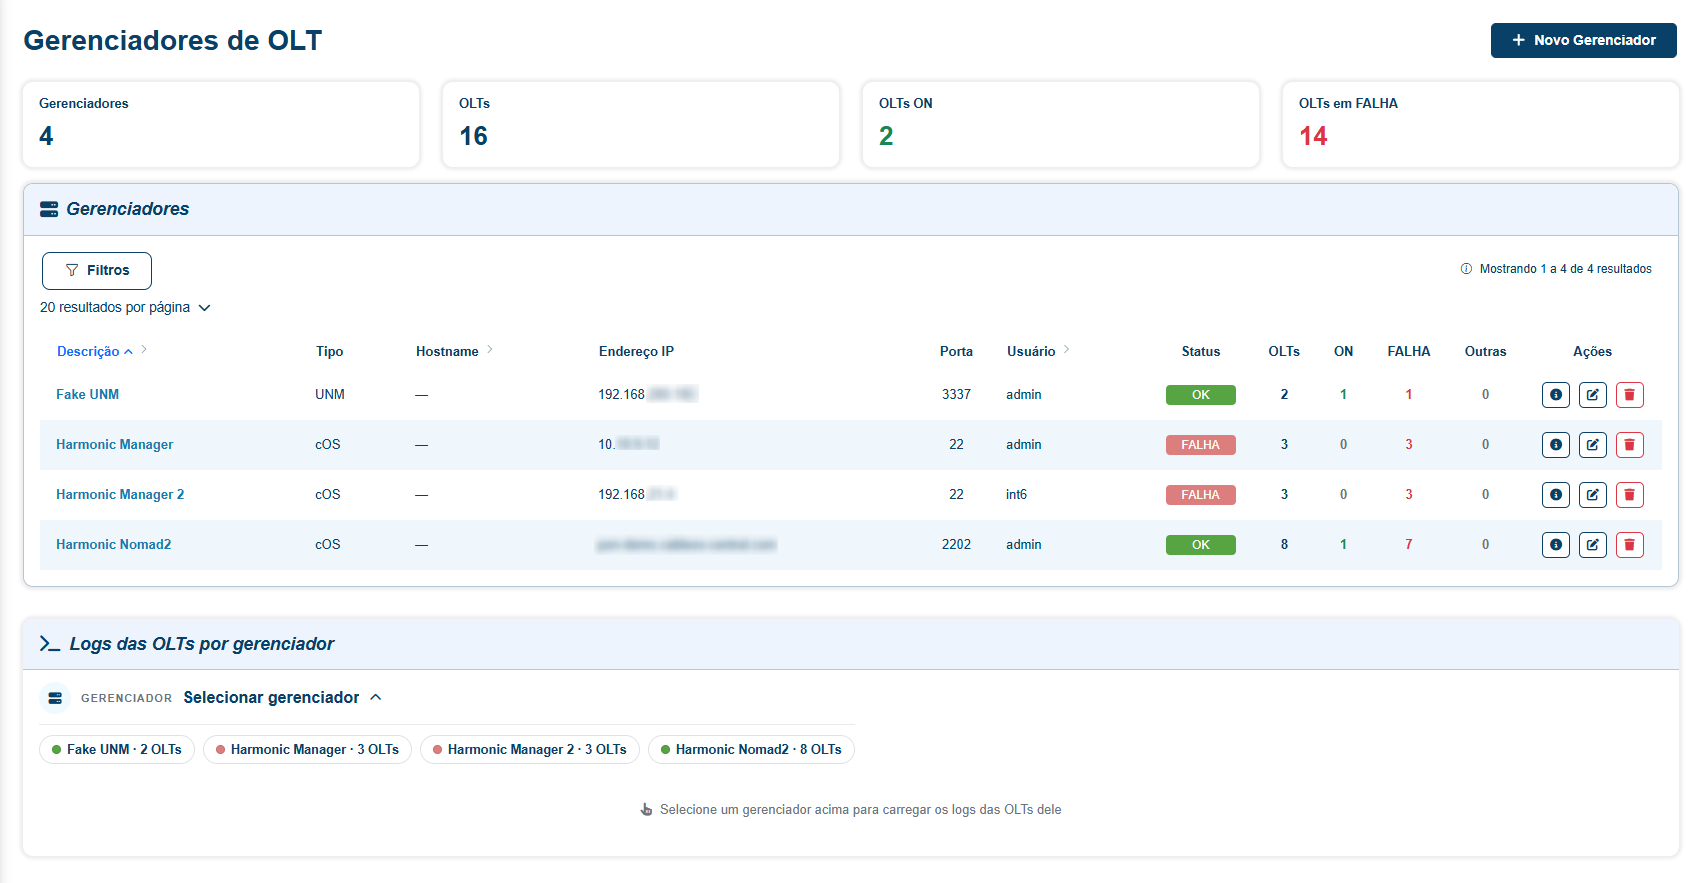
Implementation of a dedicated interface for viewing and controlling OLT Managers in the Portal.
To centralize orchestrator management, we developed a new interface structured in tabs that allows: viewing general information and asset summary (OLTs and ONUs), listing associated OLTs, accessing the Running Config, managing imported resources and Config Profiles, as well as consulting consolidated logs of the manager and its respective OLTs.
This implementation uses standardized components to maintain visual consistency with the existing OLT screens.
¶ 4. New CTO Info/Details Screen on the Subscriber Screen
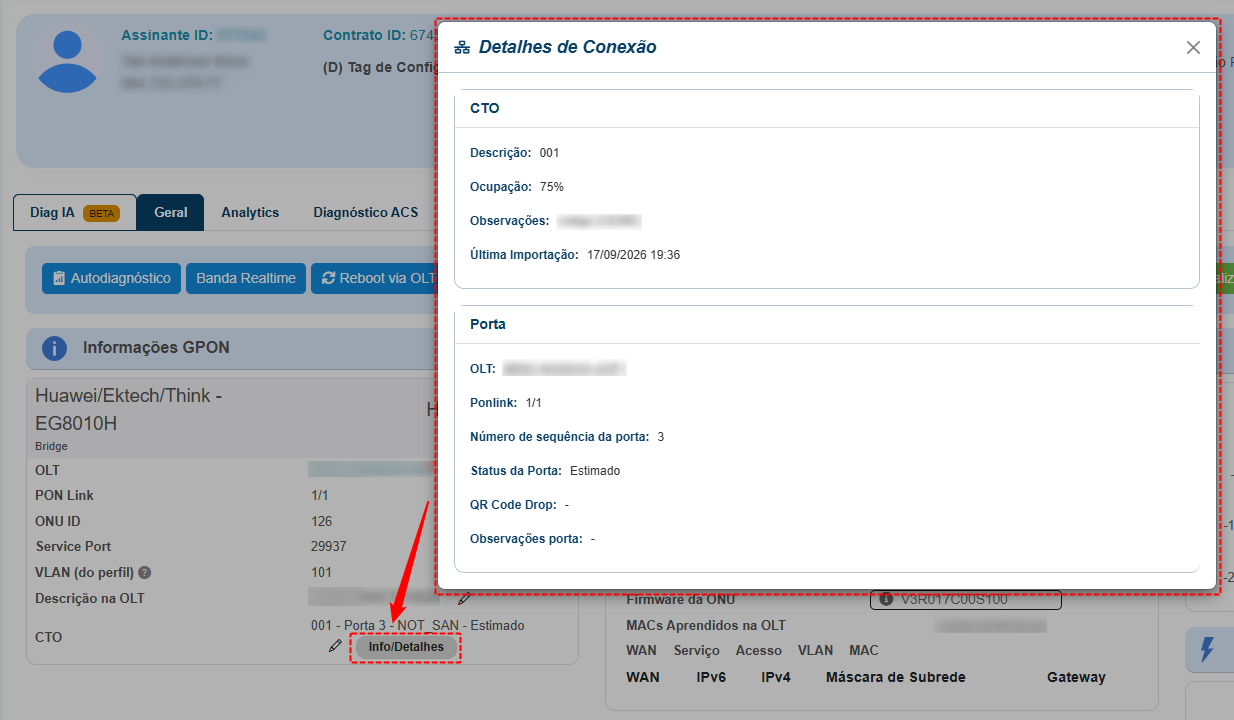
To speed up support and network data lookup, we implemented a new "Info/Details" screen accessible via pop-up on the subscriber screen.
This interface centralizes critical CTO information, including description, OLT/Ponlink identification (with divergence alerts), occupancy rate, notes, and the new QR CODE DROP field, allowing the support team to have a complete technical summary of the customer and associated infrastructure in a single click.
¶ 5. Data Source Transition for Optical Power Charts on the Subscriber Screen
Modernization of the data visualization infrastructure with greater flexibility and historical accuracy.
To offer a more robust network analysis, we implemented a new configuration that allows switching the chart data source between Zabbix and the new high-performance internal tables.
The improvement introduces quick filters for monthly, weekly, and daily views, in addition to ensuring that short-term queries use all detailed readings from the last 7 days.
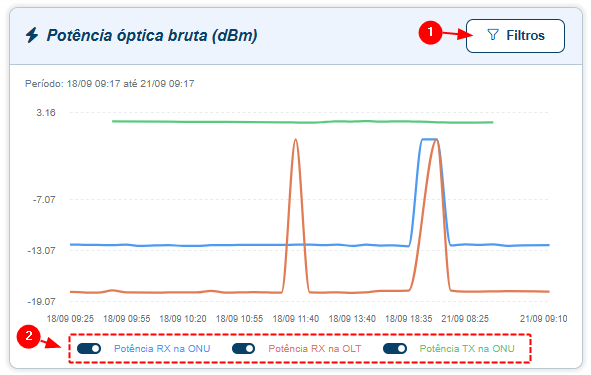
|
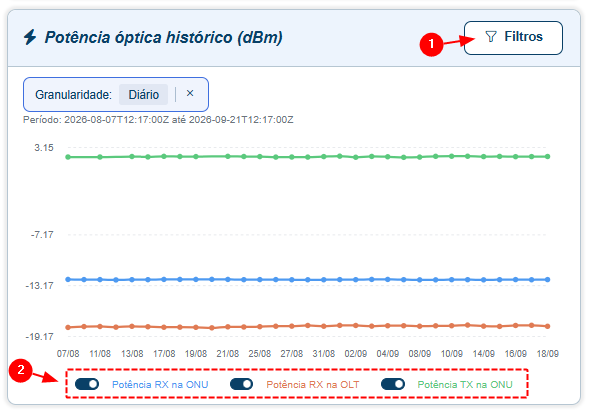
|
Prerequisites: In this version, the feature must be enabled by the Support team, upon request via WhatsApp or by opening a ticket at https://int6tech.freshdesk.com/.
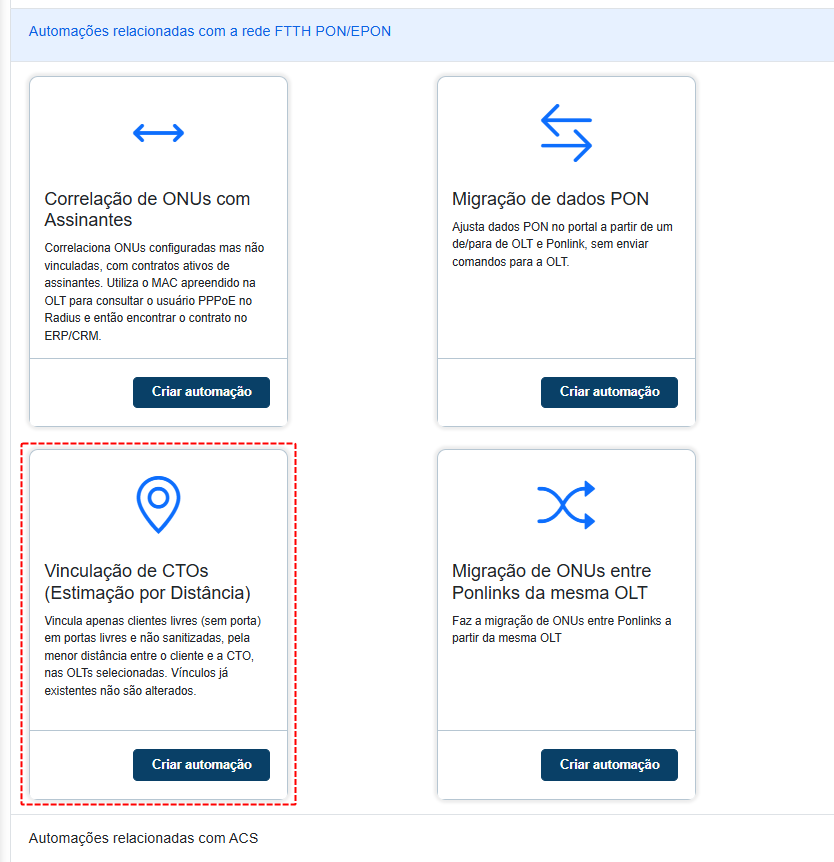
¶ 6. Automation for CTO Estimation by Distance
New geographic intelligence for automatic linking of customers to the FTTH network. To optimize network inventory organization, we developed a new automation that performs CTO linking estimation based on geographic proximity (customer ↔ box distance).
The tool allows processing specific OLTs, identifying unlinked customers and automatically associating them with the nearest free port (within a 1000-meter radius), ensuring greater accuracy in network maps and reducing manual data cleanup work.
¶ ✨ Improvements
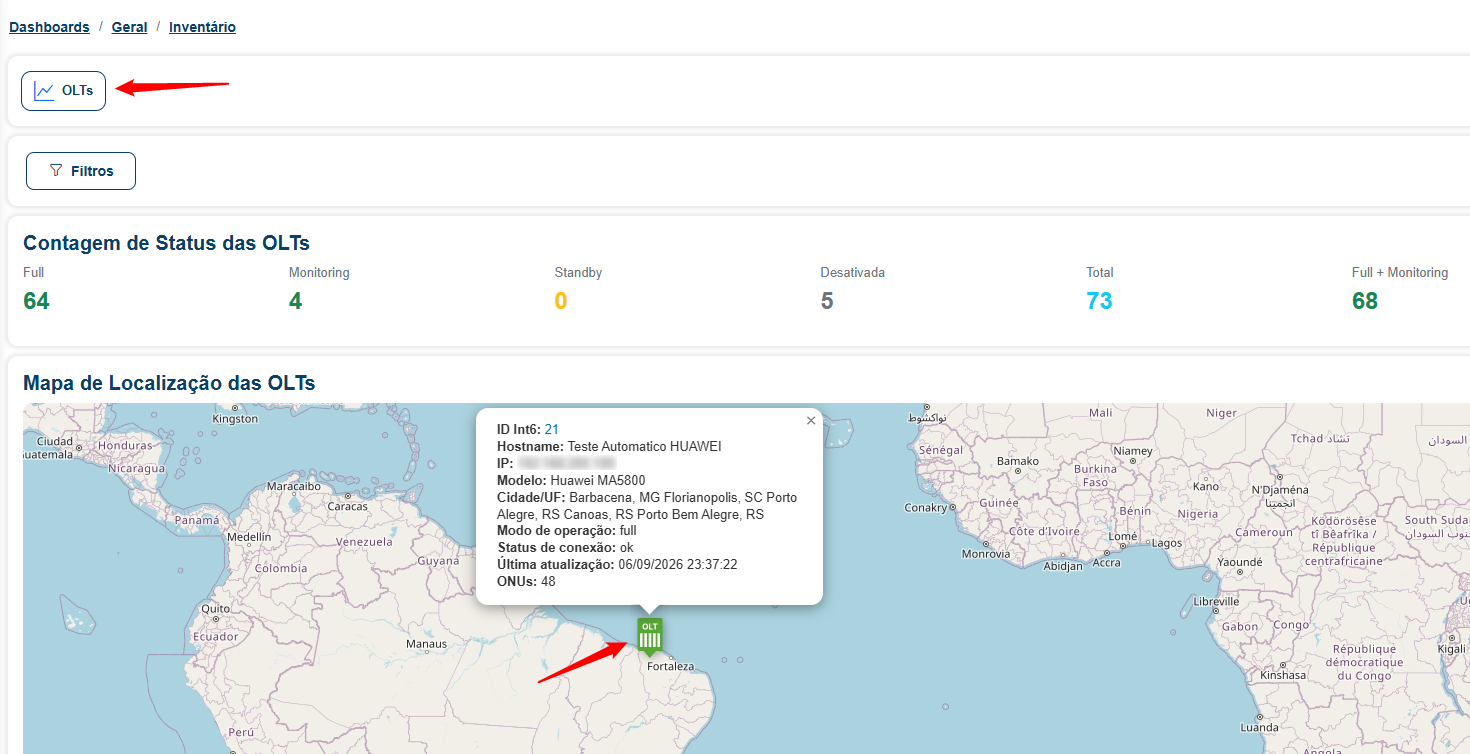
¶ 1. Improvement to the OLT Map on the Dashboard
We improved the geographic visualization of network infrastructure with the introduction of a new visual component in the inventory. To facilitate the location and monitoring of network assets, we added an interactive map to the OLT inventory dashboard that displays pins at the exact location of each OLT.
Coordinates must be previously registered for each OLT.
¶ 2. Standardization of Technical Terminology in the Portal Interface
Update of terms and translations to align with market standards. We replaced the term "GPON" with "PON" in several Portal components, such as diagnostics and infrastructure tabs; additionally, we changed the term "ONU Models" to "ONU Profiles", more accurately reflecting the logical configuration of equipment profiles in optical networks.
¶ 3. Inclusion of WiFi Interference Analysis in Self-Diagnostics
Inclusion of WiFi signal interference analysis in the self-diagnostics module. As per the summary and technical validation, we integrated WiFi interference tests into the system's self-diagnostics flow; this implementation allows the tool to identify noise or signal overlaps during the execution of automatic analysis routines.
Self-Diagnostics is available on the subscriber screen under "ACS Diagnostics".
¶ 4. Enrichment of the Mass Outage Events Endpoint with Affected CTO Data
Enrichment of the mass outage events endpoint with detailed data on affected infrastructure.
To optimize the identification of impacted resources during network failures, we updated the GET /api/massives/v1/events endpoint to include the consolidated list of CTOs affected by each event.
The improvement adds the ctos field to the main response and details cto_id, cto_description, and cto_integration_id information within the resources array (massive_events.resources), eliminating the need for supplementary queries to map the geographic impact of the mass outage.
¶ 5. Implementation of a New Response Envelope for API Errors
Implementation of a new response envelope for API errors, aiming at consistency and stability.
To unify exception handling in synchronous APIs, we updated the return_api_error method to mandatorily include the status: "fail" and generic_message fields (following the api.* standard), while maintaining compatibility with legacy fields (code, description, details).
This change also addressed inconsistencies in the message catalog (typos and ambiguous descriptions) and updated the i18n definitions in three languages.
¶ 6. Usability Improvement for Service Status History on the Dashboard
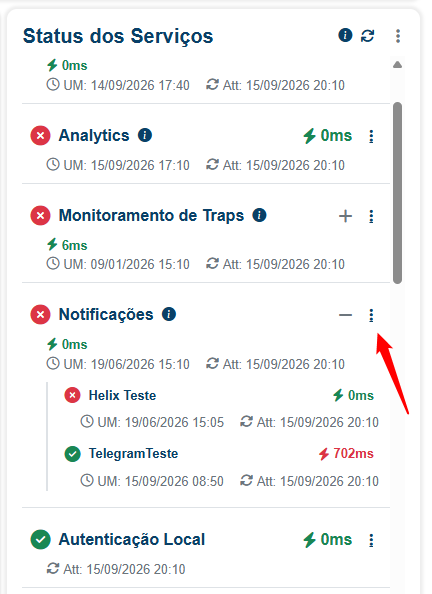
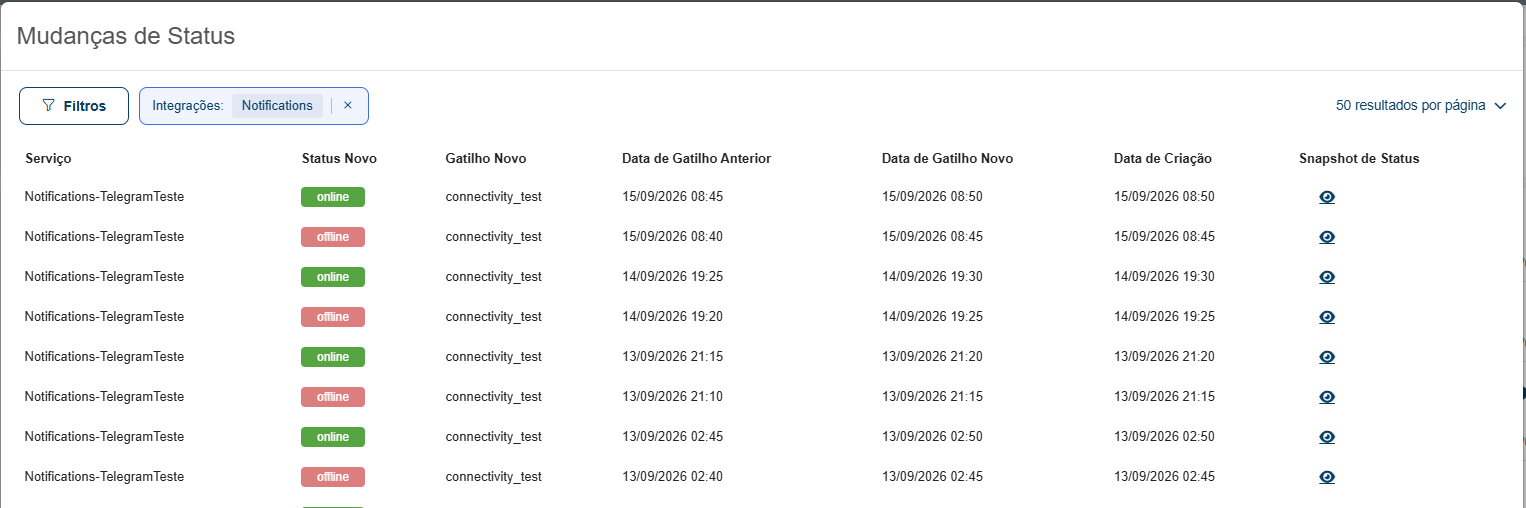
Usability improvement for the service status history screen on the Dashboard. To optimize event identification, we updated the status change screen to explicitly display the name of the related service in each row and implemented a shortcut via the context menu (⋮) that allows opening the view already filtered for a specific service.
¶ 7. Enhancement of the Plans Screen with Technology Description Field
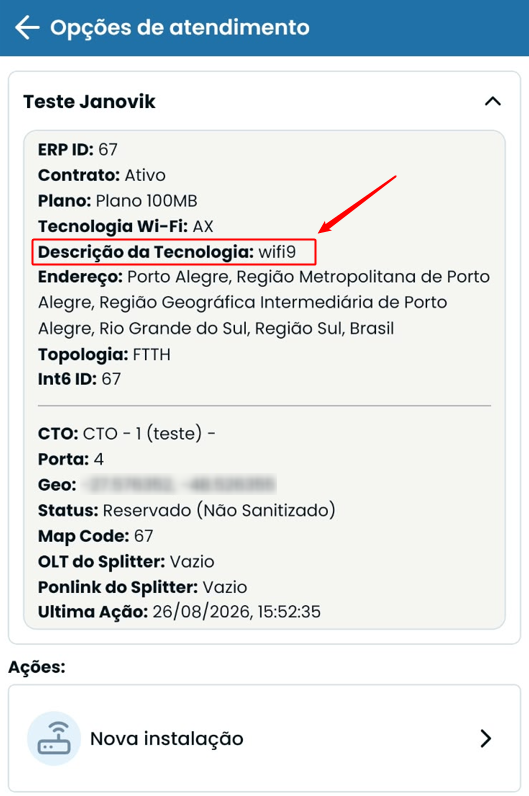
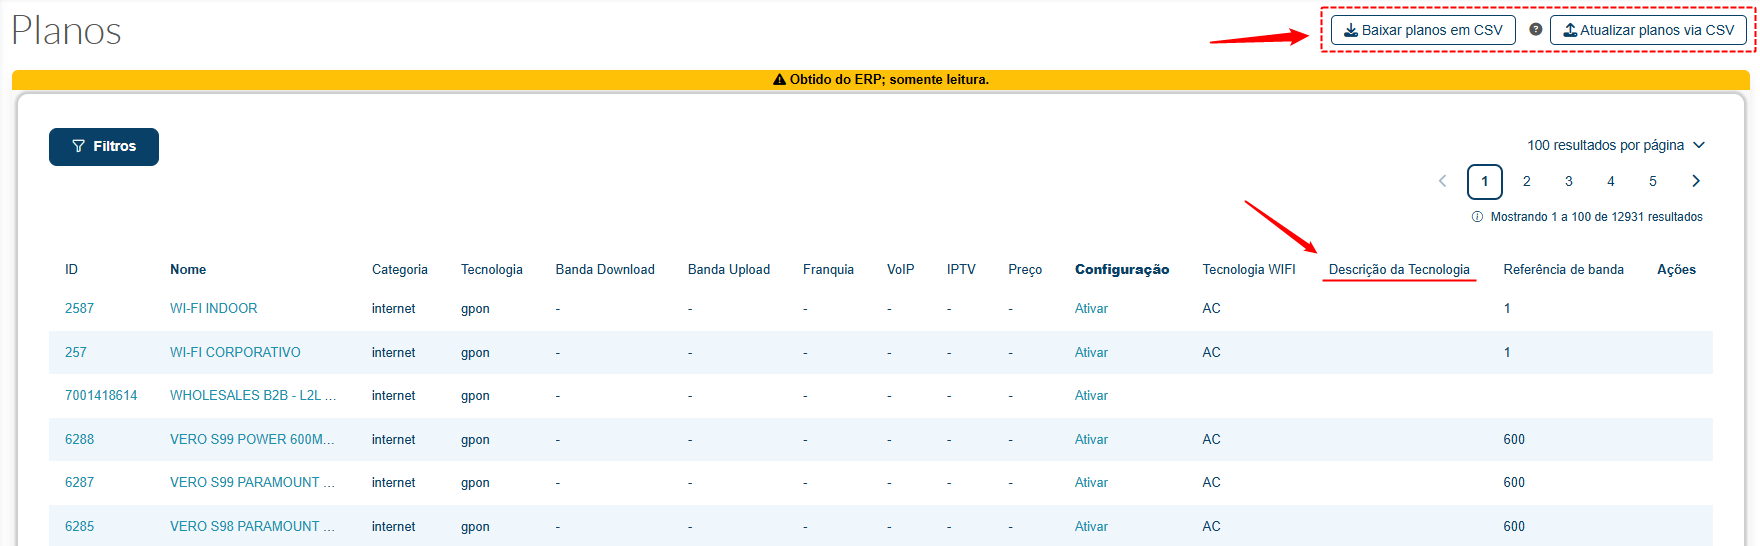
Enhancement of the plans interface with new descriptive fields and bulk editing tools. To facilitate the work of field technicians, we added the "Technology Description" field to the Portal's plans screen and to the app menu, allowing quick identification of the required Wi-Fi standard (e.g., Wi-Fi 5, 6, or 7) for each service.
We implemented the plan export to CSV feature, allowing the administrative team to download all records, edit customizable fields, and perform a bulk upload for agile catalog updates.
¶ 8. Optimization of ONU Data Collection
Optimization of data collection for ZTE, Nokia, Fiberhome, Datacom, Harmonic, Intelbras, and other vendor ONUs, reducing processing and the execution of unnecessary CLI commands.
¶ 9. New Connection Request Failure Report on the ACS Dashboard.
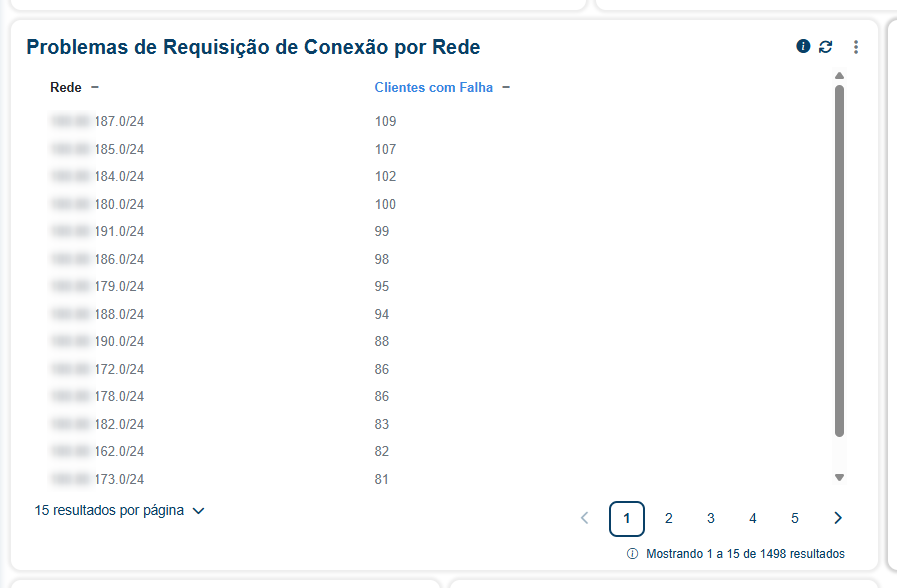
New diagnostic tool on the ACS Dashboard for identifying mass communication failures. To assist in detecting network issues that affect device management, we created a new report on the "Quality → ACS" dashboard that lists customers with connection request failures (excluding credential errors).
¶ 10. Improvement to the Wi-Fi Interference Visualization on the ACS Diagnostics Tab
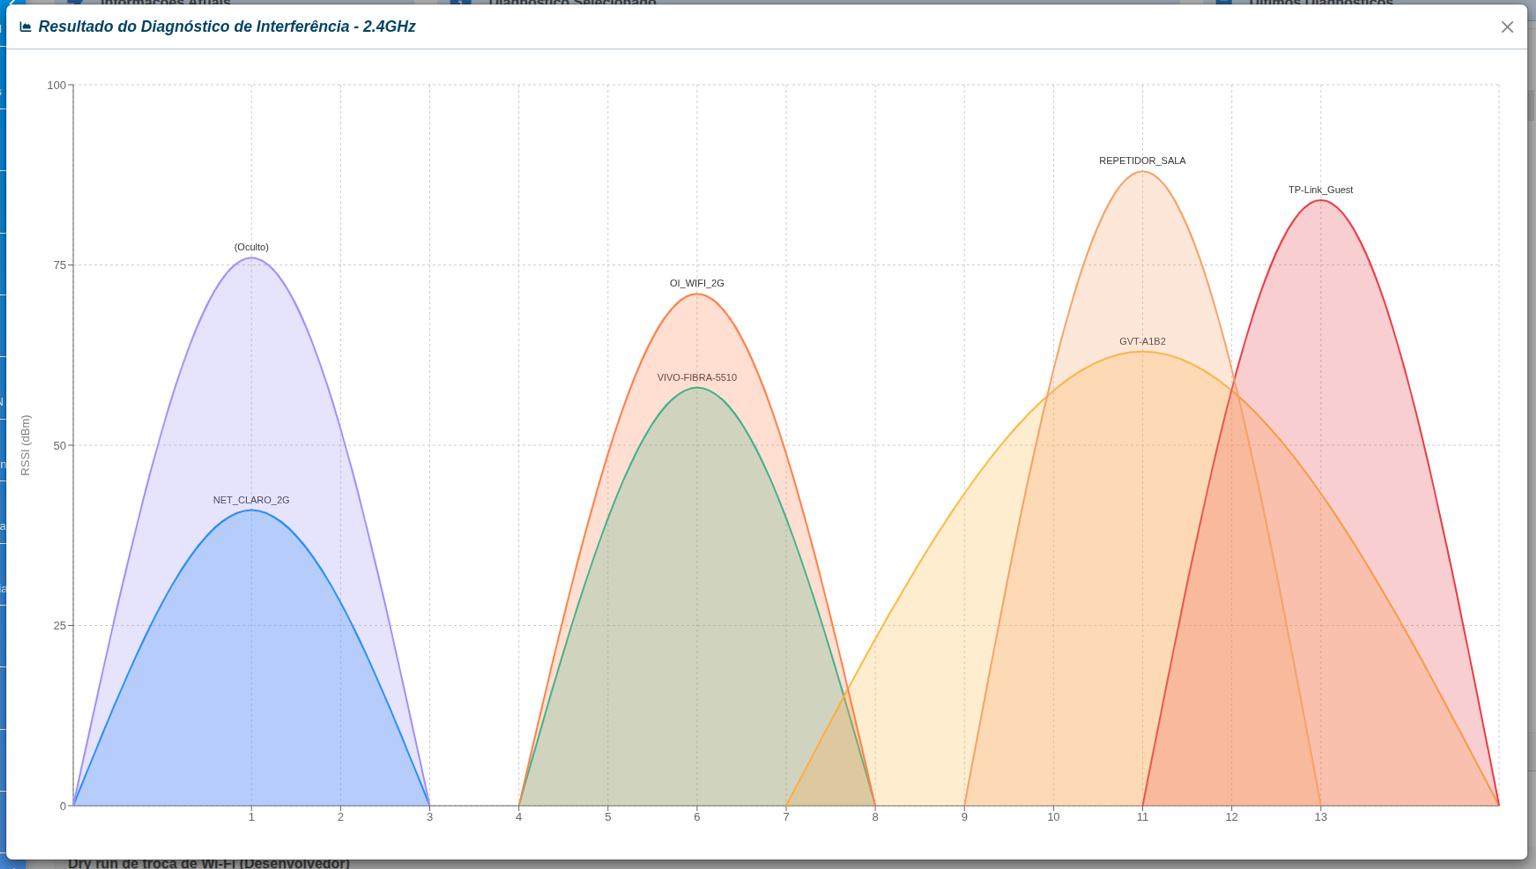
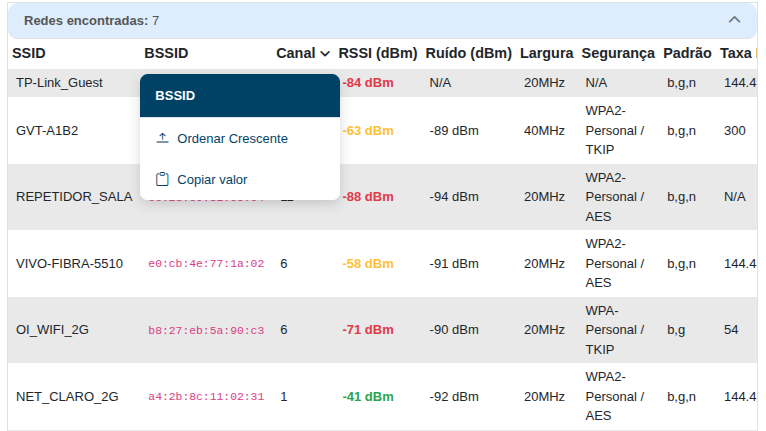
To facilitate technical spectrum analysis, we implemented a full-screen feature for the 2.4GHz and 5GHz charts, allowing an expanded view of neighboring networks; additionally, we optimized the layout with collapsible tables by default and added data sorting capability (with initial focus on RSSI), ensuring that support can quickly identify the main sources of interference in the customer's environment.
¶ 11. Improvement to the Tag System for GPON Scripts
Enhancement to network command execution accuracy with distinction between OLT and Manager contexts.
To avoid ambiguities in the execution of provisioning scripts, we modernized the GPON tag system, introducing specific identifiers such as <olt-cli>, <olt-tl1>, <manager-cli>, and <manager-tl1>.
This change allows the system to route commands exactly to the correct connection adapter (directly to the OLT or via the management system), ensuring greater operational security and maintaining compatibility with legacy scripts during the transition.
¶ 12. Equipment Visibility by MAC Address in GPON Editing on the Subscriber Screen
Improvement to hardware identification to facilitate ONU provisioning with partial data.
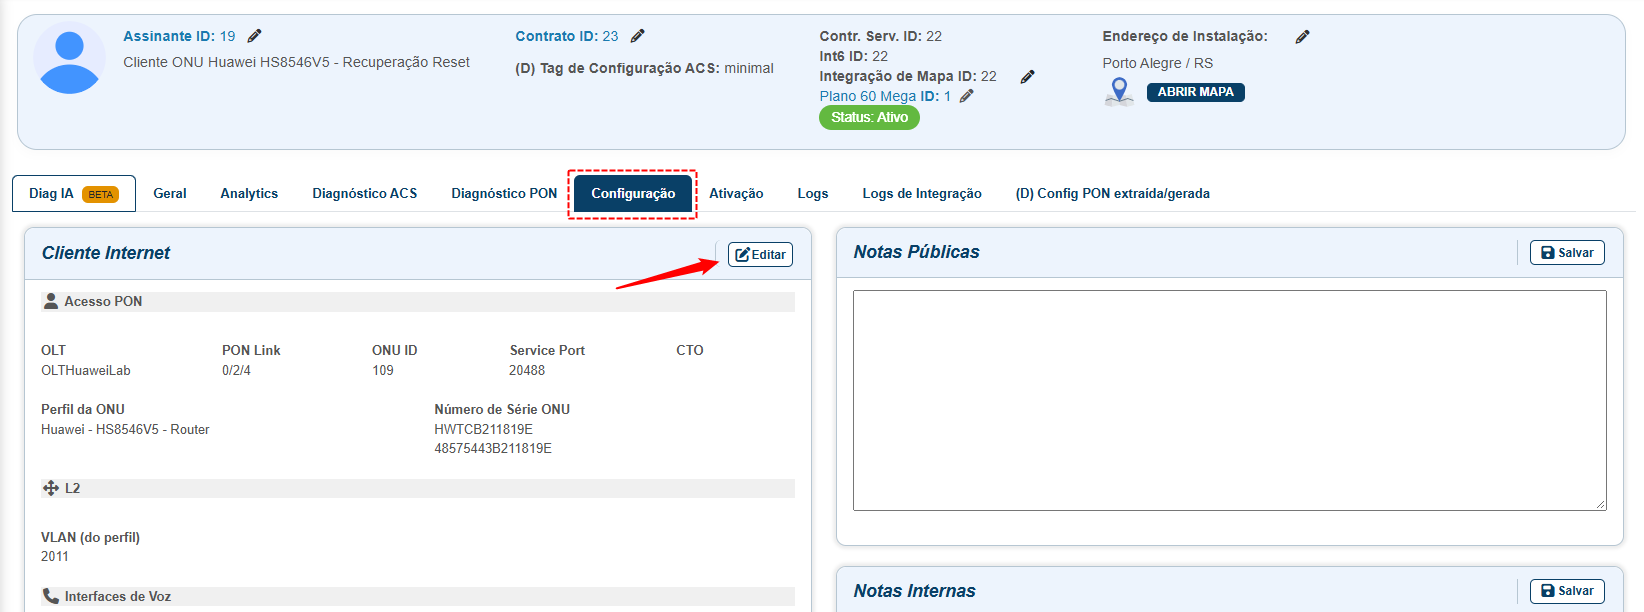
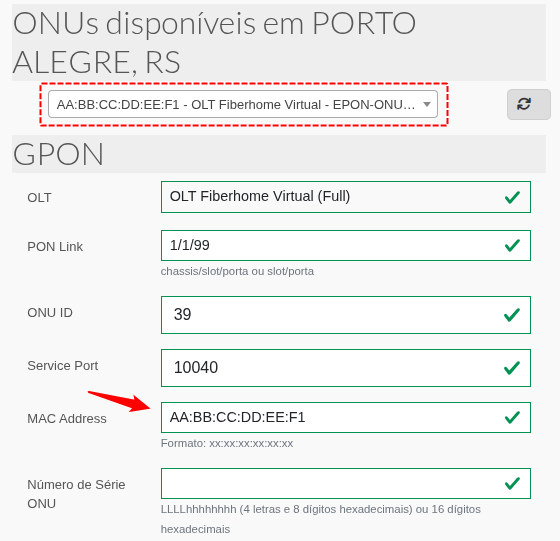
To ensure that no equipment goes unnoticed during configuration, we updated the "Edit GPON Customer" screen to display ONUs that only have the MAC Address available. When performing an ONU/ONT search via find_ponlink or discover_all, these devices appear labeled by their MAC Address in the equipment selector.
¶ 🐞 Fixes
¶ 1. Fix in the API Response for ONUs without Optical Power Readings
Fix in the API response to ensure VLAN information is sent for ONUs without optical power readings.
We identified that, when an ONU did not support power readings or was on the exception list, the Portal returned a simplified object that omitted essential fields such as tagged_vlan and OLT manufacturer information.
We fixed the response logic to include the complete object, allowing the app and provisioning flows to correctly identify the need for VLAN tagging even on equipment without optical power telemetry.
¶ 2. Fix in Passing Network Parameters to Provisioning Templates via WebDriver
To ensure the correct configuration of CPEs, we adjusted the data flow so that critical information present in the Portal — such as VLANs and OLT manufacturer — is properly passed on to the app; this fix resolves the communication failure that prevented the application of templates dependent on these parameters during the provisioning process.
¶ 3. Fix in the Display of Mesh Devices Connected to the ONT
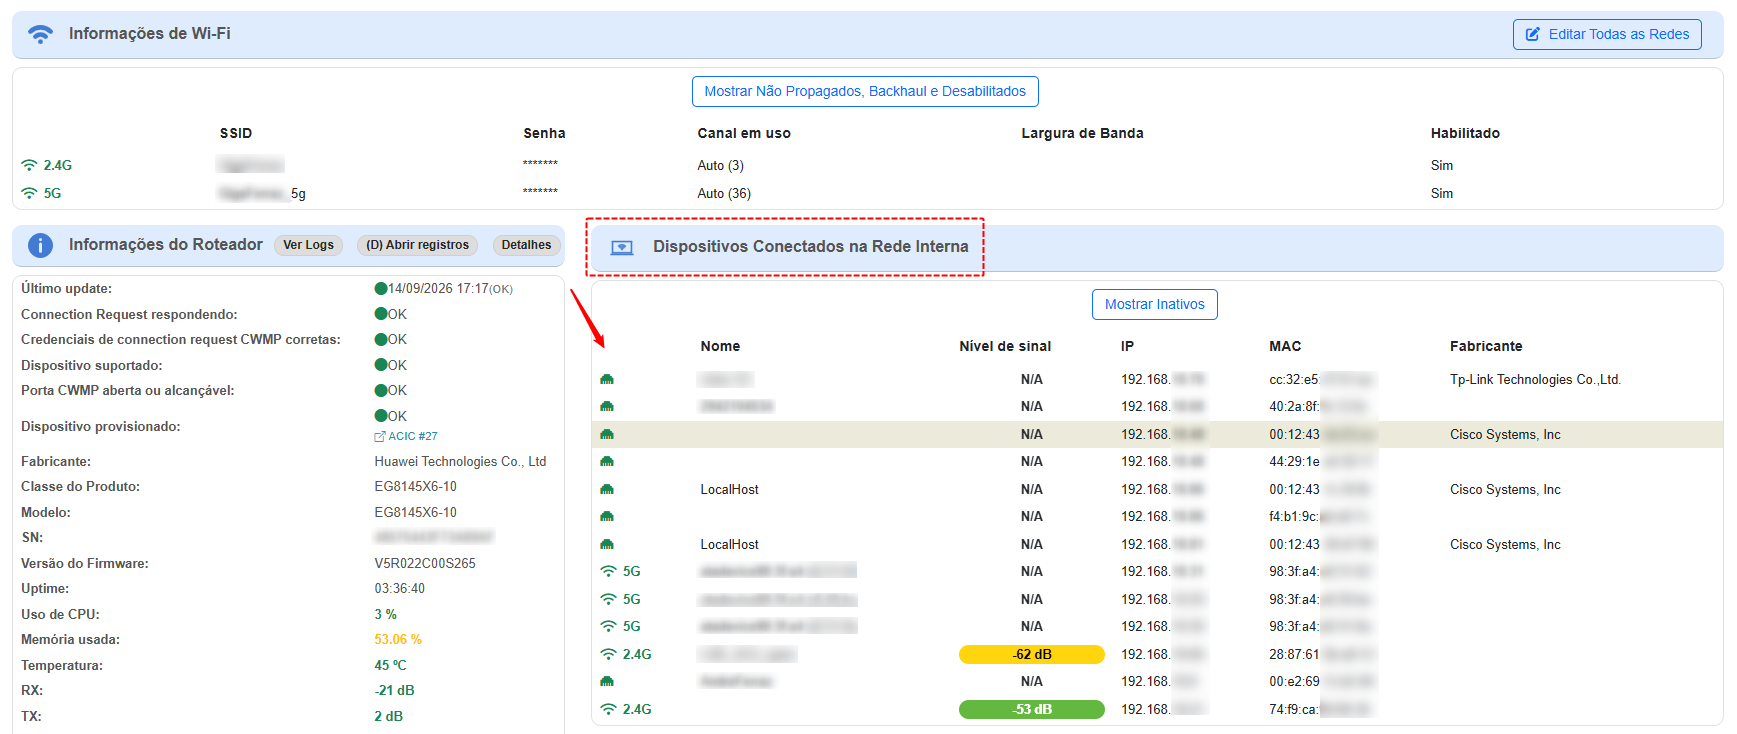
Fix in the display of Mesh devices connected to the ONT in the Portal interface, with adjustments to the collection and display of these devices.
¶ 📲 Technician APP - Improvements and Fixes
¶ 1. Display of WiFi Technology in the Technician App
To ensure the technician can choose the correct equipment model according to the plan's needs, we added the display of the WiFi technology description linked to the contract on the app screen. This field must be filled in when registering plans in the portal.