¶ What is a Custom Dashboard?
The Custom Dashboard is the platform tool designed to create and organize customized screens for different analysis purposes.
It allows users to bring together different perspectives on the data within a single environment, making it easier to access information, organize analyses, and navigate between different views.
Each view can contain one or more dashboard components, allowing users to combine indicators, information, and visualizations according to a specific analysis objective.
This way, users can structure different views according to their monitoring and analysis needs, bringing together in each one the components that are most appropriate for the intended context.
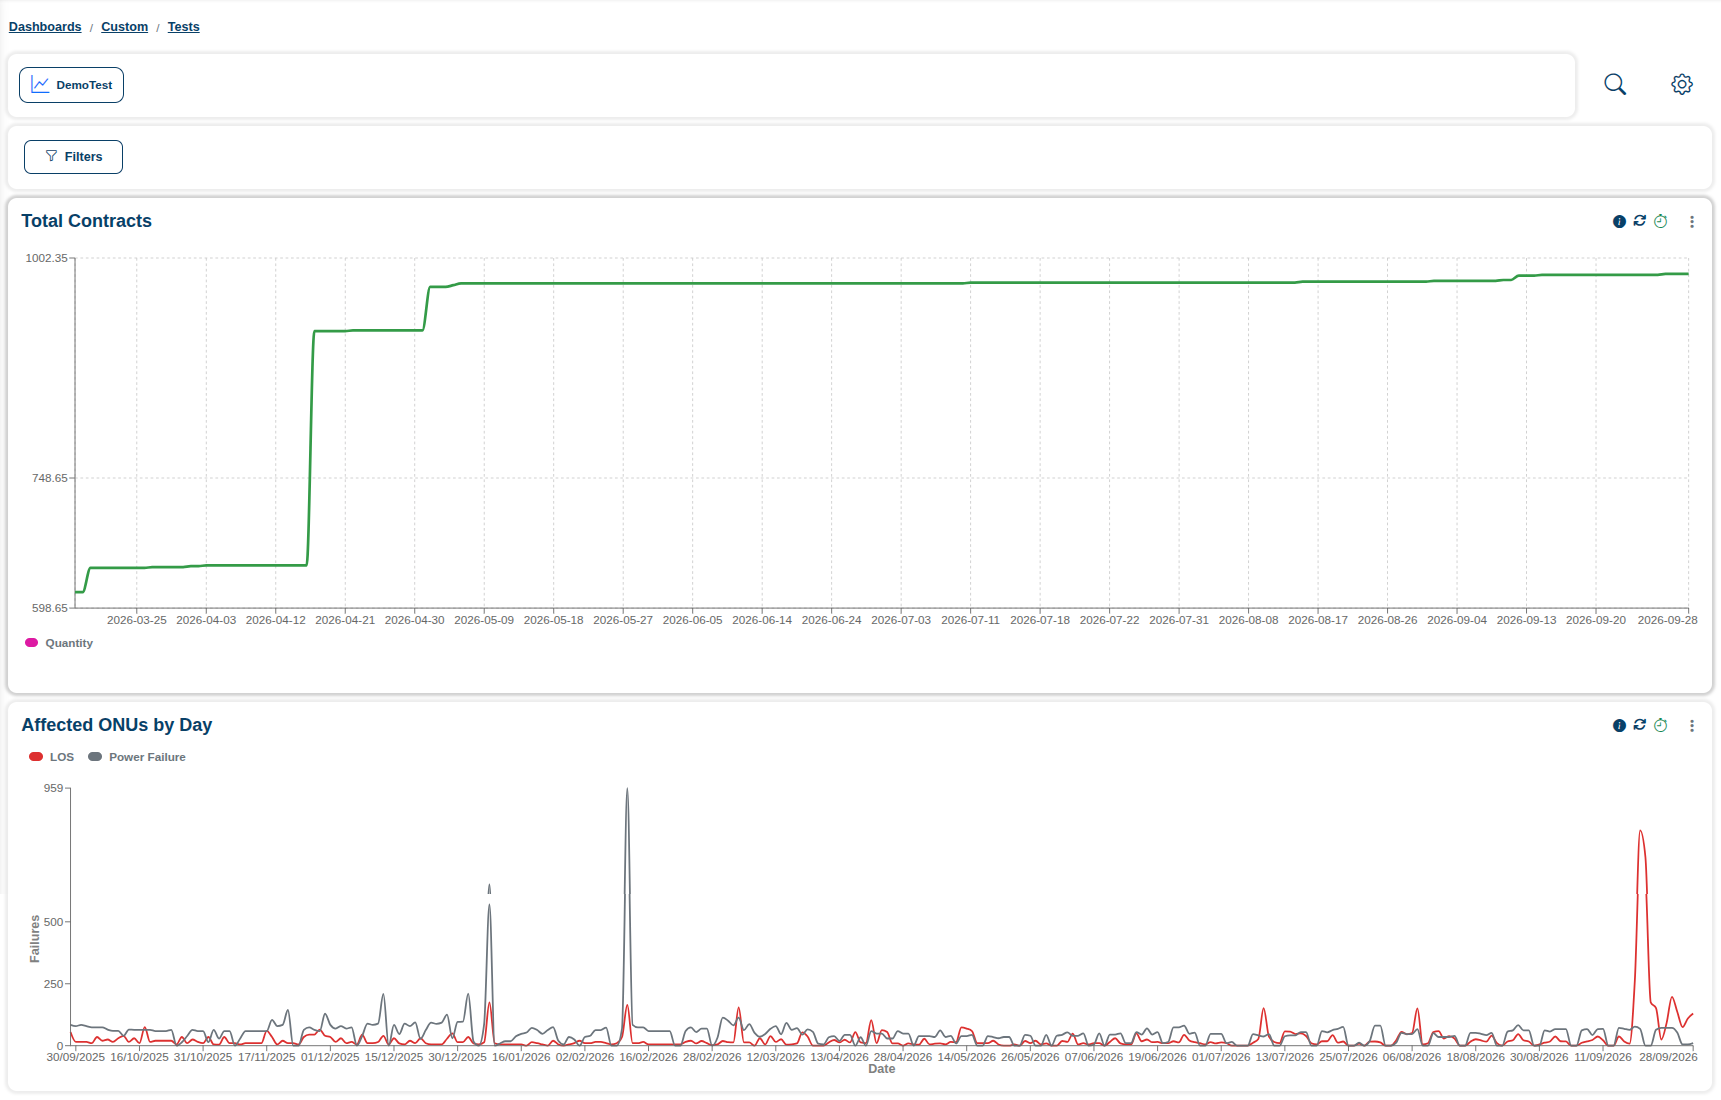
On the Custom Dashboard screens, users can access features to locate, create, and manage views.
In the upper-right corner of the screen, users can access the tools used to locate and manage registered views.
- Search icon (🔍): used to locate existing views.
- Settings icon (⚙️): used to access the Custom Dashboard management options.
By default, when accessing the Custom Dashboard, the system displays the General Overview.
All views can be cloned for later use.
However, only customized views can be edited or deleted.
Users can also view additional information about each view, such as the user responsible for creating it and its registered description.
Directories are used to organize views related to the same topic, purpose, or analysis context.
This feature makes it easier to locate screens and helps keep the Custom Dashboard structure organized, especially when a large number of views are registered.
It is also possible to add access rules associated with user profiles.
Component creation allows users to develop new visualizations based on the data available on the platform.
Components are built through queries on existing data and can later be used to compose customized views.
Depending on the type of analysis being created, this configuration may require more in-depth knowledge of the available data structure and the different visualization types offered by the platform.
Dashboard creation allows users to generate a new structure based on an existing dashboard.
This feature makes it easier to reuse previously defined configurations, components, and structures, reducing the need to configure all elements of a new dashboard again.
As with the other dashboards on the platform, the components displayed in the Custom Dashboard may include filters.
The available fields vary according to the components included in the view and the data used in each analysis.
The main available filters include:
| Filter | Description |
|---|---|
| Contract City | Filters the data according to the city associated with the contract. |
| Contract State | Filters the data according to the state associated with the contract. |
| OLT City | Filters the data based on the city where the OLT is located. |
| OLT State | Filters the data based on the state where the OLT is located. |
| OLT Name | Allows users to select data related to a specific OLT. |
| ERP ID | Allows users to locate and filter information using the corresponding identifier in the ERP system. |
| OLT Model | Filters the results according to the OLT model. |
| User | Allows users to filter data according to the user associated with the displayed information. |
| ONU Serial Number | Allows users to locate a specific ONU using its serial number. |
| ONU Status | Filters the information according to the ONU status. |
| Connection Status | Allows users to select data according to the connection status. |
| Ponlink | Filters the data according to the Ponlink associated with the analyzed devices. |
| Time Range | Defines the period considered in the reports and components displayed in the view. |
| ONU RX (minimum/maximum) | Allows users to define minimum and maximum ONU RX values to restrict the displayed data. |